A spring's water for a village
on the highlands of Madagascar
In Mahalavolona, on the Malagasy highlands, a captured spring flows below the village. The distribution reservoir sits 18 metres higher and 500 metres further away. The study covers a fully solar supply, with no grid and no generator.
The need, as the municipality expresses it
The village has grown and the existing gravity supply no longer keeps up. The good news is already in place: the captured spring fills a 32 m³ buffer tank by gravity at the foot of the village. What remains is the lift: carrying 32 m³ a day up to the distribution reservoir that overlooks the houses, so the water can then flow back down on its own to the standpipes.
Site specifics: no borehole. The pump is immersed directly in the buffer tank, 2 metres below the surface. And no reliable electricity nearby: fully solar pumping, without batteries, is the natural choice.
The input data in LE LAB
A few minutes of input. The solar reference city is Antananarivo, around a hundred kilometres away, on the same highlands and at the same altitude as the site. The depth entered is only 2 m, since the pump is immersed in the tank; the 21 m delivery head covers the elevation gain and the reservoir height. The total head is calculated automatically: 38 m, of which 41% comes from the pipe's head losses. Over 500 metres, the pipe weighs almost as much as the lift: that is exactly what a sizing must account for.
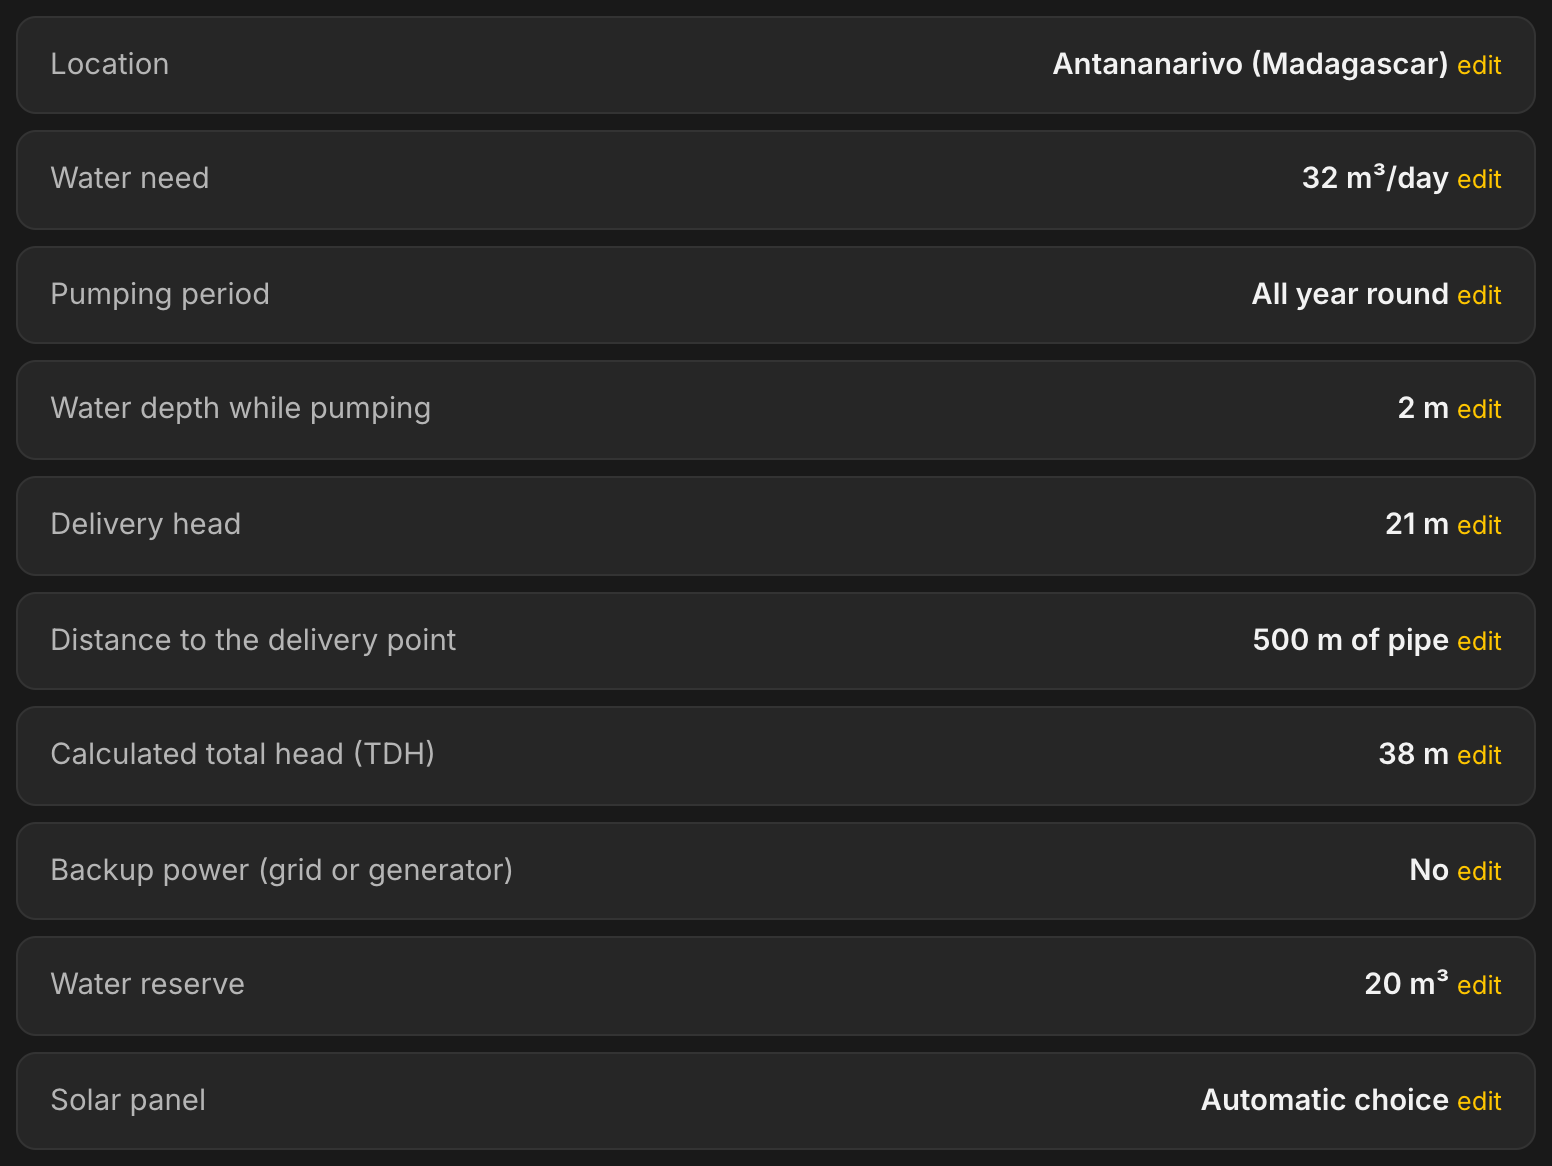
The summary before calculation: nine answers are enough, the total dynamic head is calculated for you.
What LE LAB proposes
Four panels. To lift the water for a whole village, the chosen solution is a LORENTZ PS2-1800 with the HRE-32 end, a helical rotor, powered by 4 panels of 515 Wp, for 2,060 Wp in a single string. Average production: 44.0 m³ per day, from 38.1 m³ in June to 48.5 m³ in October. LE LAB recommends three panels at the tightest; the study keeps four, through the pro solar-array adjustment, to lift June and July above the need. The array stays this small because the head stays moderate and the highlands' sunshine is generous and steady. This is the frugality typical of a well-sized fully solar pumping system: no batteries, very few panels, no fuel.
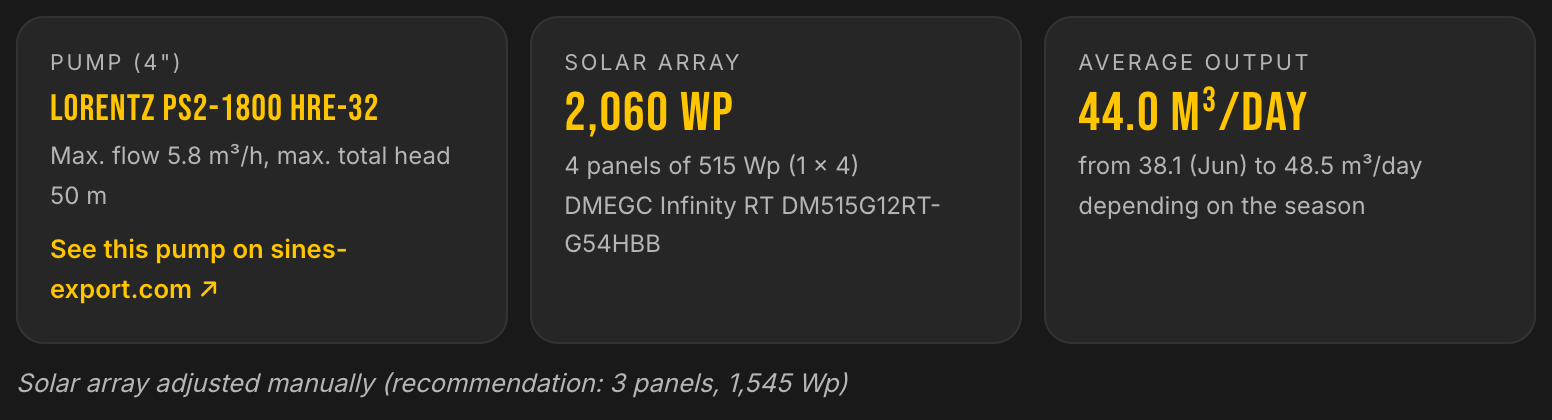
The solution at a glance: pump, solar array and average production.
Panels laid almost flat, without losing anything
At this latitude, the calculated optimal angle is 21°, with panels facing due north since we are in the southern hemisphere. But a low, gently tilted frame is simpler to build locally and offers less grip to the wind, a real concern in a country exposed to cyclones. LE LAB's angle setting quantifies the trade-off.
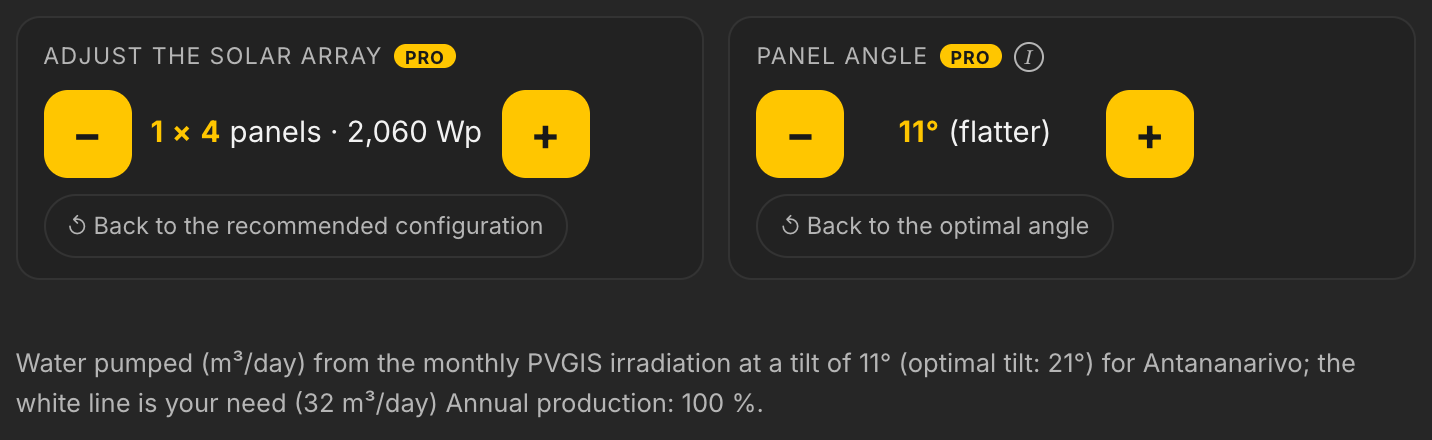
At 11°, annual production stays at 100% of the optimum: the simple frame costs nothing, and this pitch is enough to let rain rinse the panels.
Production, month by month and hour by hour
Monthly production is read against the need, over sixteen years of the region's PVGIS solar history. The low point is in June, the austral winter: 38.1 m³ per day, above the 32 m³ required; July follows at 39.3 m³. The other months range between 40.4 and 48.5 m³. The rainfall curve shown tells the other half of the climate: from 475 mm in January to 46 mm in September, the long dry season is exactly when the spring's water becomes precious.
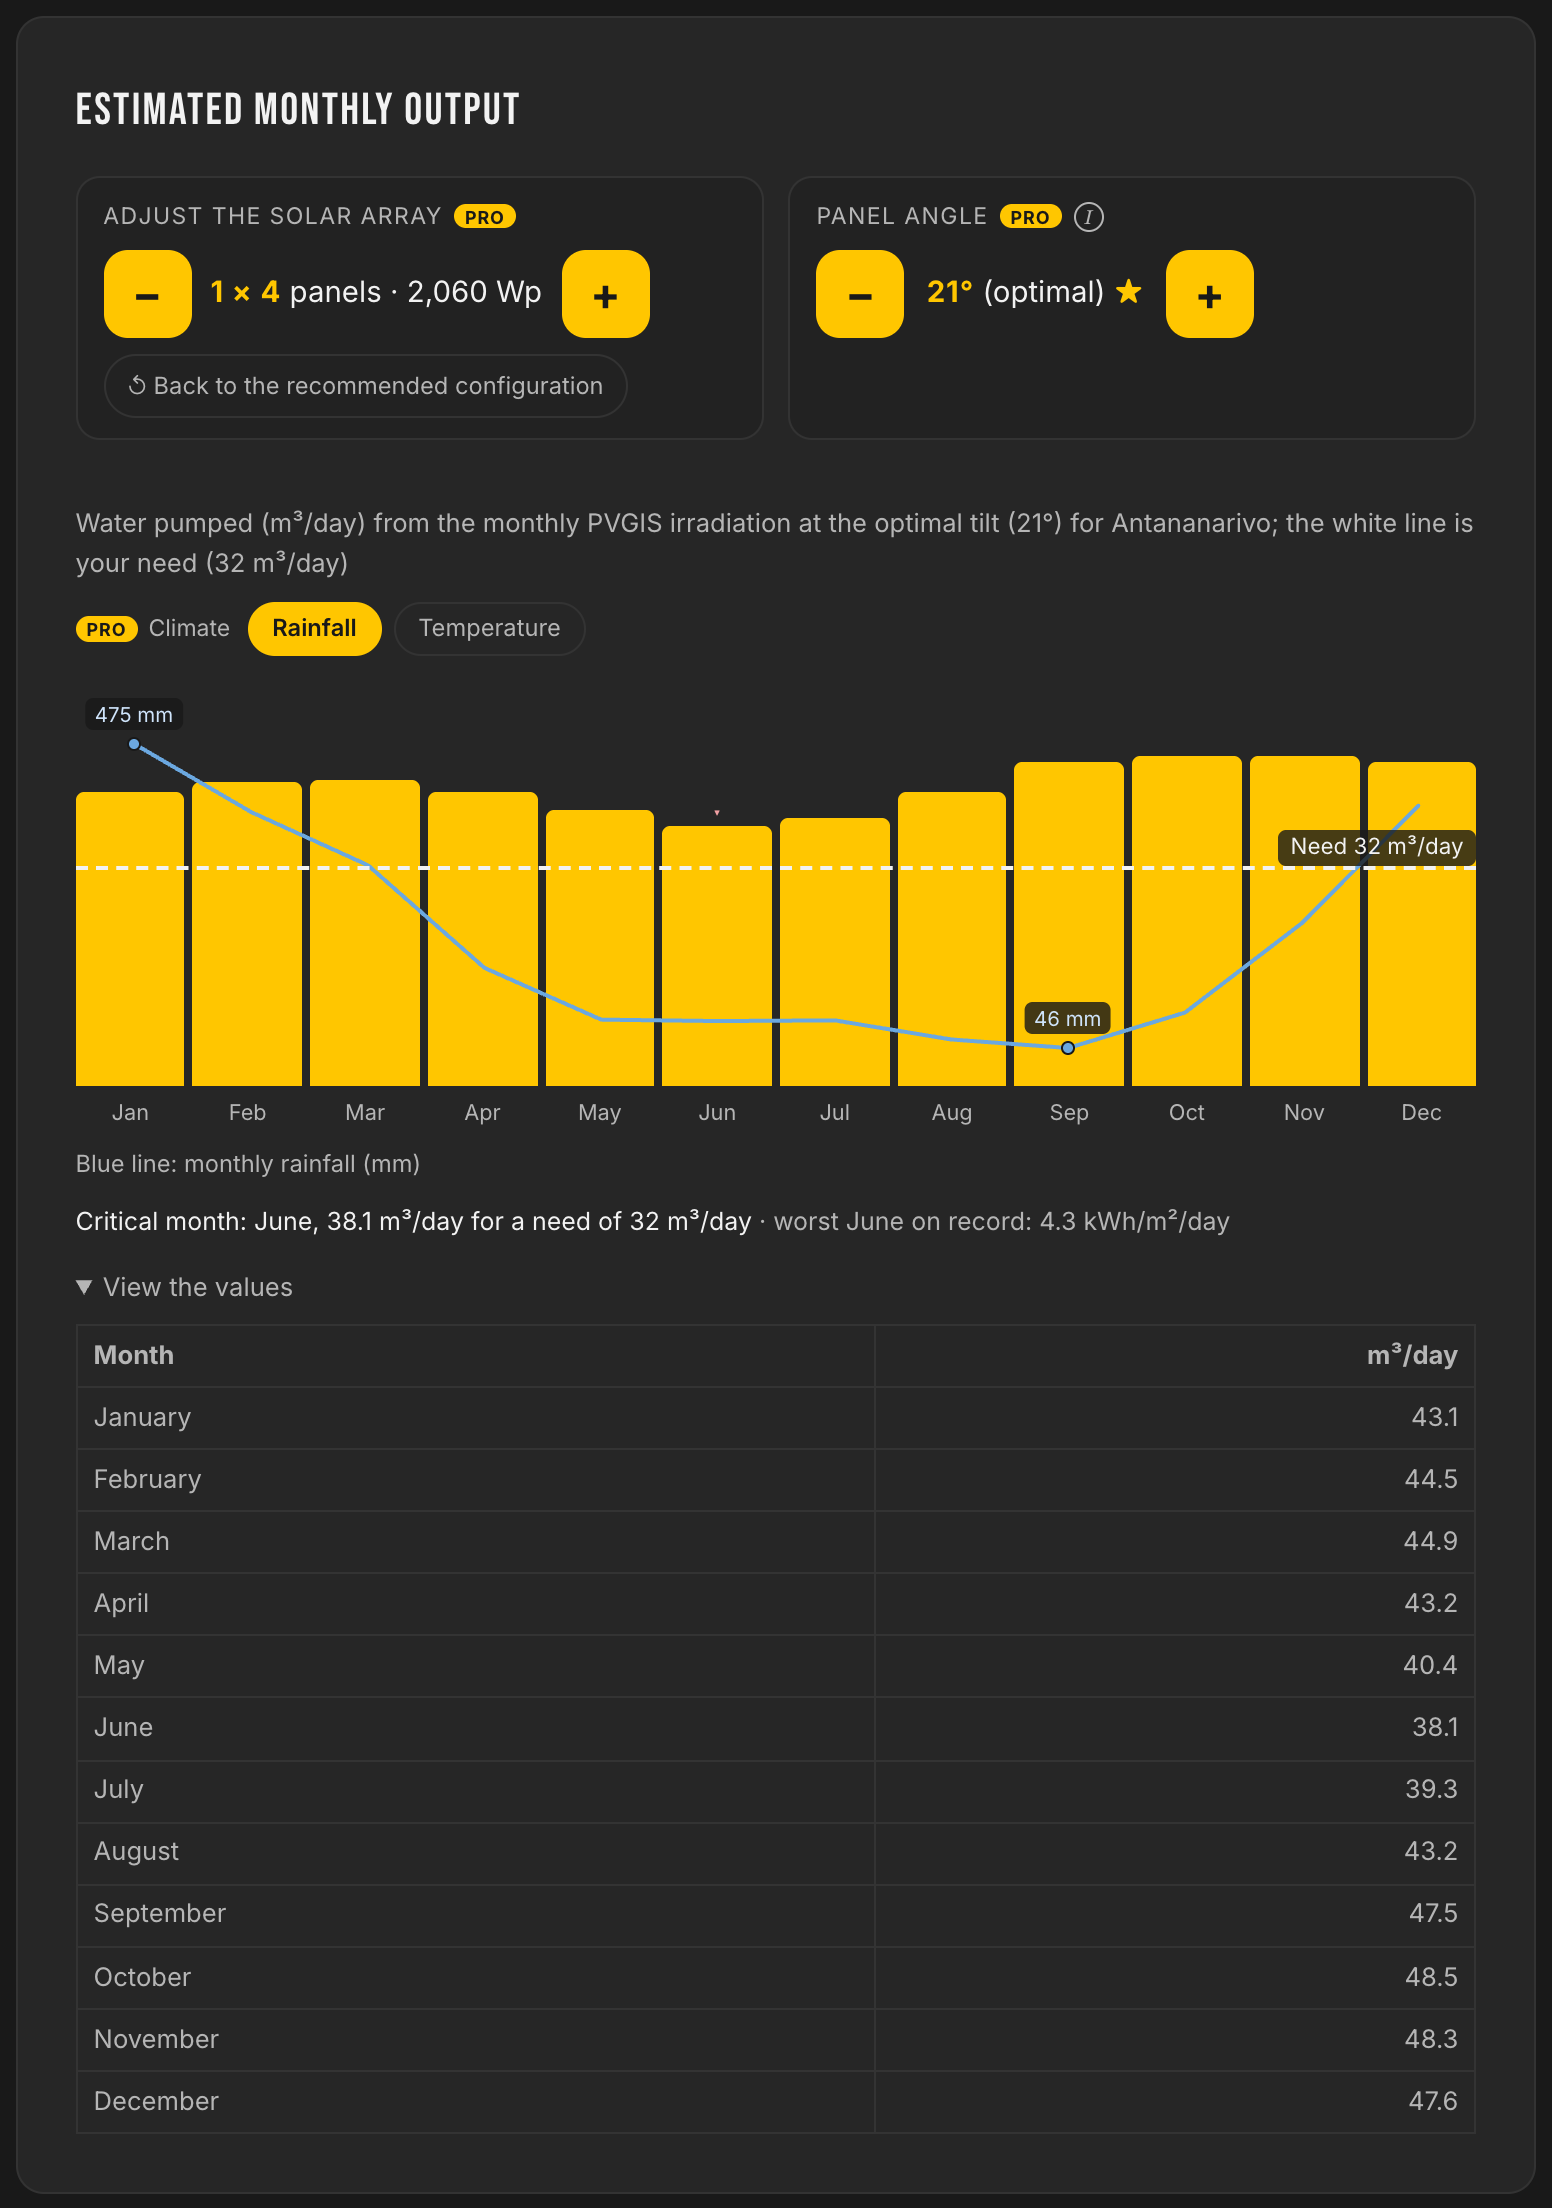
With the fourth panel, every month stays above the need line, June and July included. The critical month is shown, not hidden.
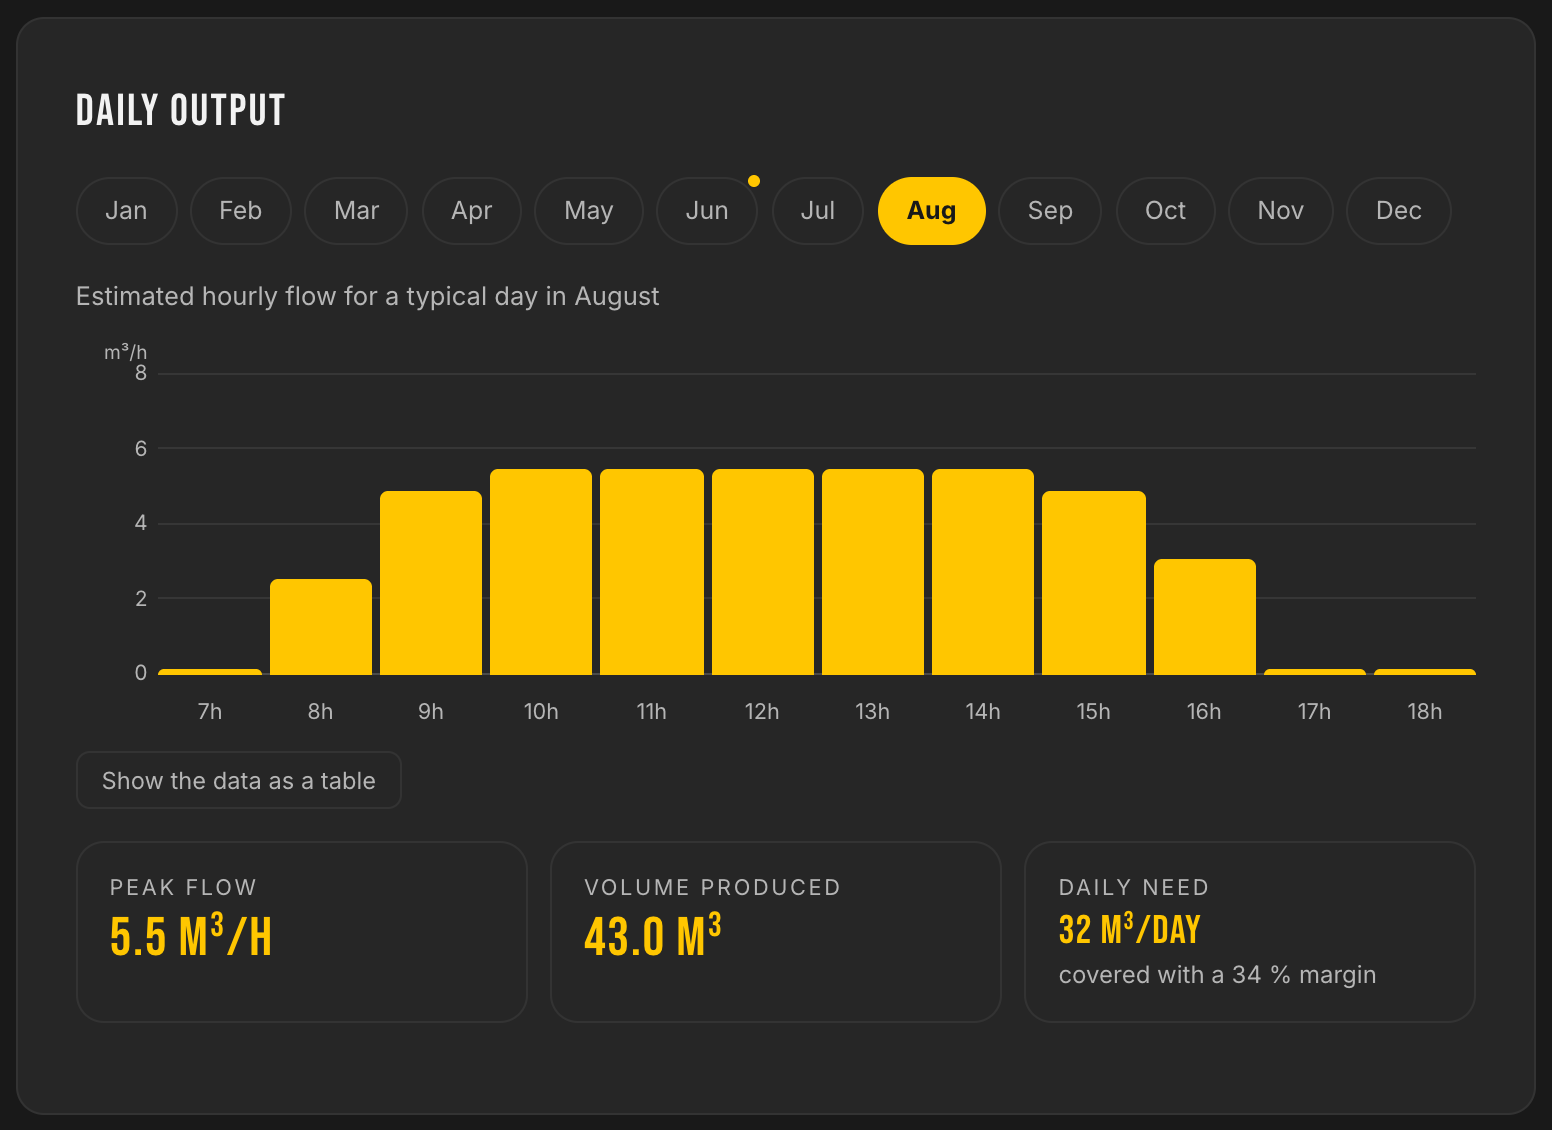
The typical August day, hour by hour: the pump climbs to 5.5 m³/h during the hours of full sun and produces 43.0 m³, a 34% margin on the need.
The 20 m³ reservoir put to the test
LE LAB simulates the water reserve day by day over sixteen years of PVGIS weather history. With the 20 m³ reservoir alone, 355 of 365 days are fully covered. LE LAB still flags insufficient coverage, because incomplete days remain: 10 in an average year, which still deliver 73% of the need. The volume missing over the year comes to 83 m³ out of 11,688, or 0.7%. The worst episode of the sixteen simulated years: from 2 to 11 January 2009, 10 days of low sun.
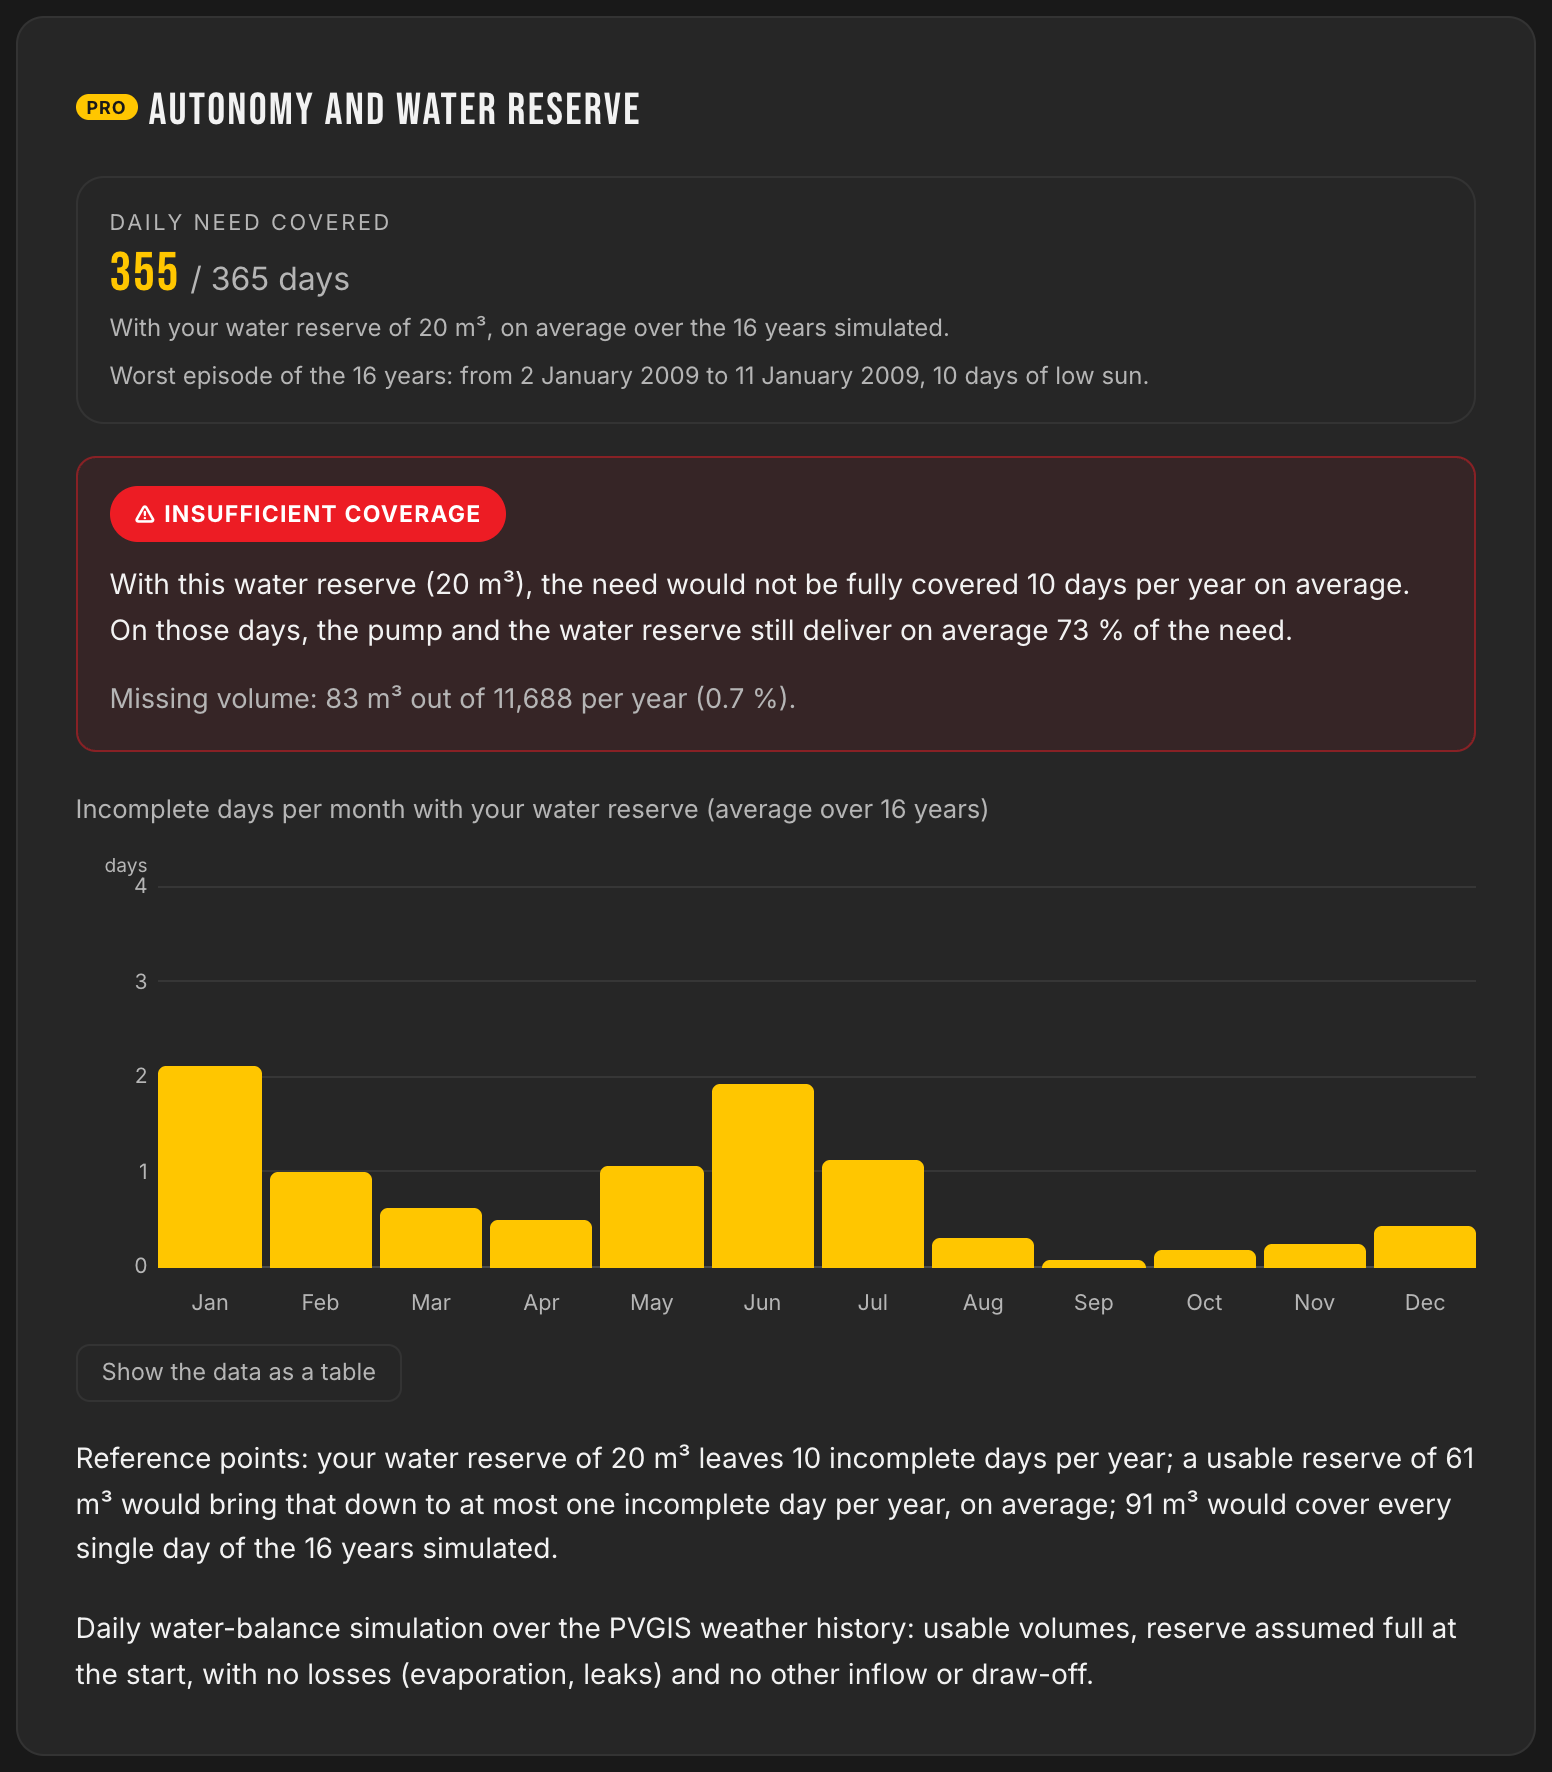
The benchmarks quantify the next step if the municipality aims for zero shortfall: 61 m³ would bring incomplete days down to no more than one per year, 91 m³ would cover every single day of the sixteen years.
Manufacturer curves, at the real operating point
The pump's Q/H curves, plotted from official LORENTZ data, with the project's head highlighted: 5.5 m³/h on the 38 m curve, at the pump's maximum. The HRE-32 accepts up to 5.8 m³/h and 50 m: the project's head stays well below that ceiling, while the flow sits at the top of the range.
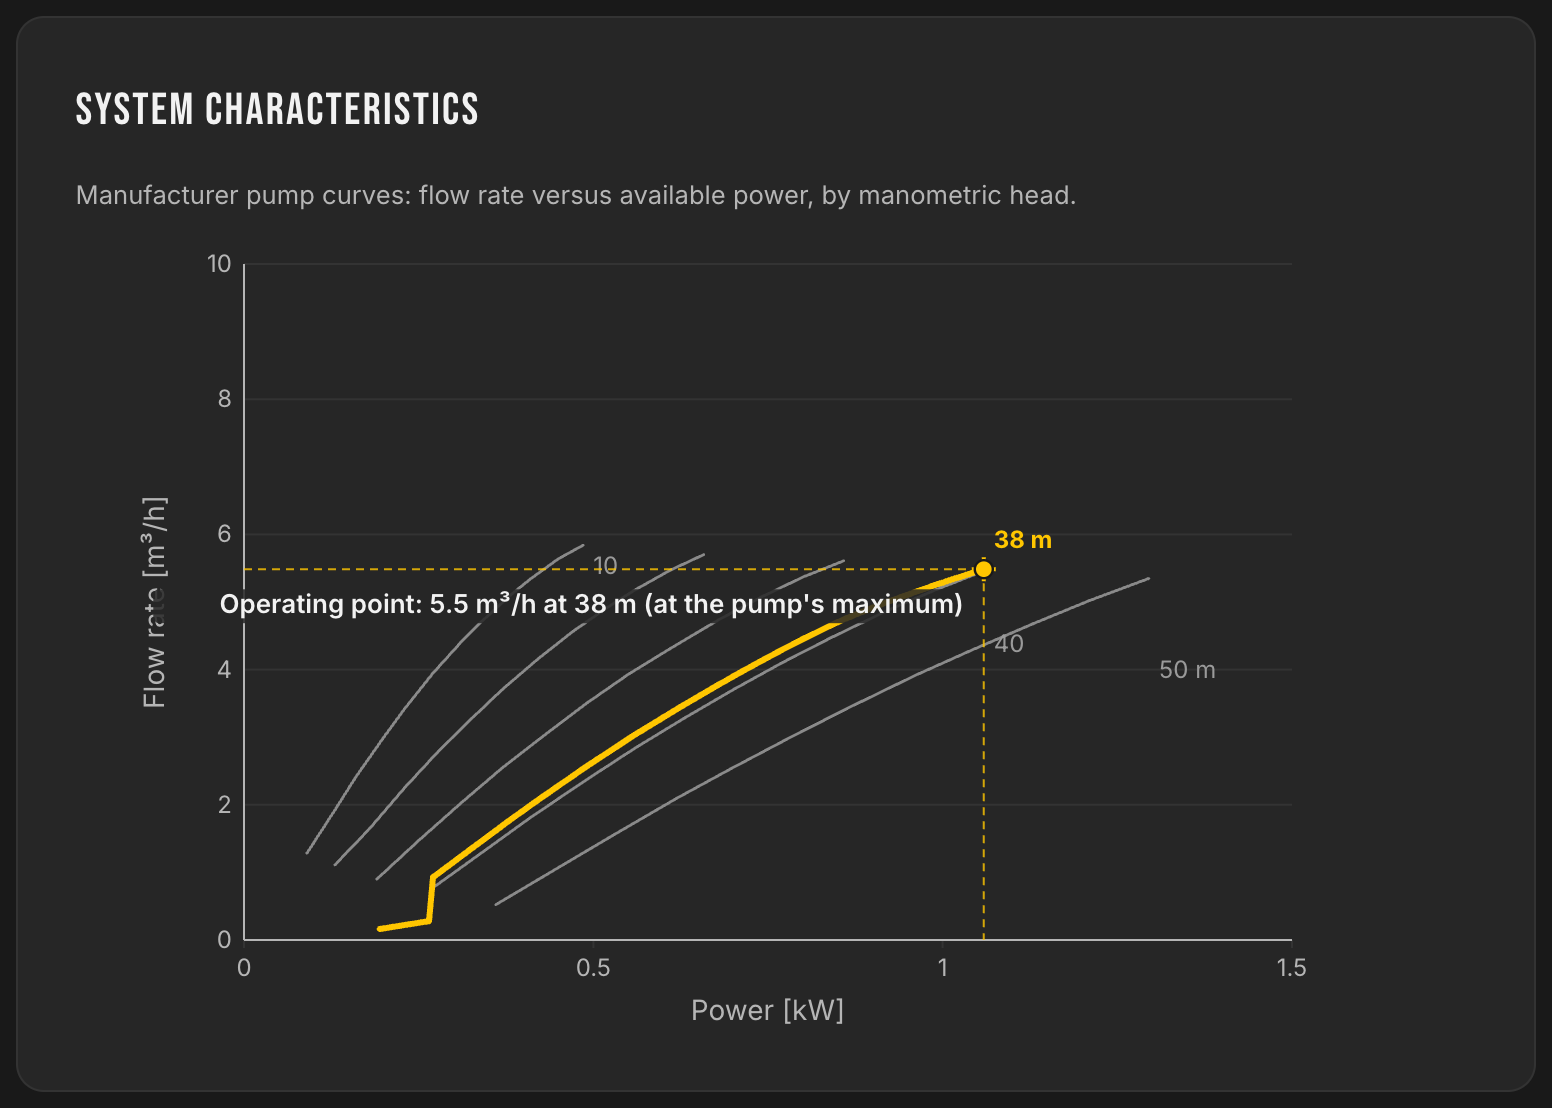
Flow according to available power, by head. The yellow curve is the project's, at 38 m.
The tool frames, the trade decides
Your project deserves the same study
Replay this study with your own figures: location, need, spring or borehole. Free, no registration, results in a few minutes.