One hectare of yellow kiwis
irrigated by solar in South-West France
This study covers one hectare of yellow kiwis, about five hundred plants, fed from a river and already equipped with a micro-irrigation network. The current pumping, driven by the tractor power take-off, provides seasonal irrigation and frost-protection sprinkling. The project consists of transferring daily irrigation to a solar pump, while keeping the thermal set for night-time needs.
Site data and existing installation
The plot holds one hectare of trellised yellow kiwis, drip irrigated. The river lies at the foot of a bank about three metres high. The network and the filtration already exist; their reuse remains subject to checking the acceptable flow, the head losses and the level of filtration required. The project keeps the thermal installation for frost-protection sprinkling and assigns the new solar system to daily irrigation.
Data entered in the application
The climate reference city is Toulouse. The use selected is irrigation, with the closest available category, “Citrus and other fruit trees”, applied to an area of 1 hectare, that is a reference need of 40 m³ a day. This choice serves as the basis for the need in the application; it is not an agronomic classification of the kiwi. The pumping period runs from April to October and the watering mode is drip irrigation. For the water intake, the study uses 3 m of height between the water and the bank, 2 m of delivery head up to the delivery point and 120 m of pipe. Neither backup power nor water reserve is declared. From these data, the application establishes a total dynamic head of 20 m.
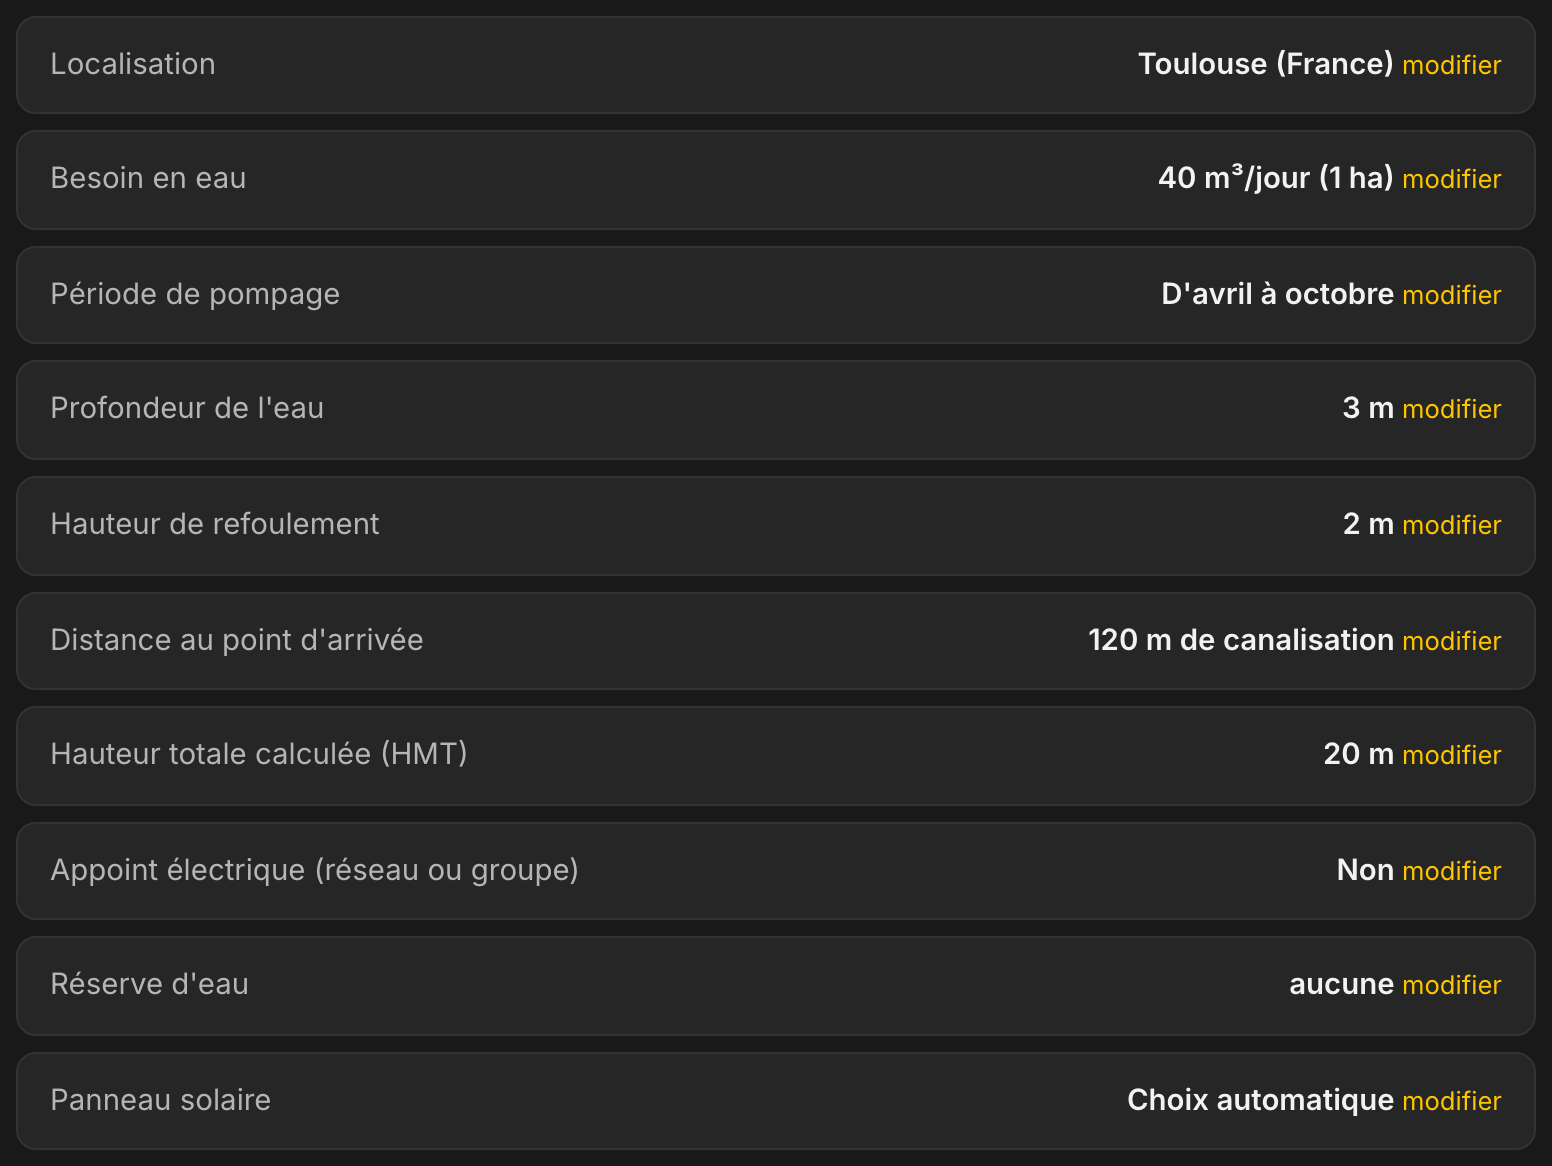
The summary before calculation. The total dynamic head is calculated for you, it is not to be entered.
The solution selected by the study
LE LAB selects a GRUNDFOS SQF 5A-7, a 4-inch submersible with integrated electronics, whose envelope covers 9.0 m³/h and 50 m of head. The array counts 3 panels of 630 Wp in a single string, that is 1,890 Wp. Over the period from April to October, average production settles at 58.9 m³ a day for 40 required. The recommended pipe is HDPE Ø 50 mm PN 10, inside bore 44.1 mm, where the water travels at 1.46 m/s at the pump's maximum flow — and more slowly at the actual operating point —, within the window recommended by the application.

The solution at a glance: the pump, the array and the average production over the declared period.
Monthly production and a typical day
Estimated average production reaches 65.5 m³ a day in July and 45.8 m³ in October, the least favourable month of the declared period and the sizing month of the season. Every monthly average from April to October stays above the need of 40 m³ a day. This reading is not a daily guarantee: a very overcast spell can produce less than the need. With no water reserve and no backup power, the organisation of irrigation must therefore keep the flexibility required for working at the pace of the resource. The winter months remain visible on the chart, even though the sizing covers only the declared period.
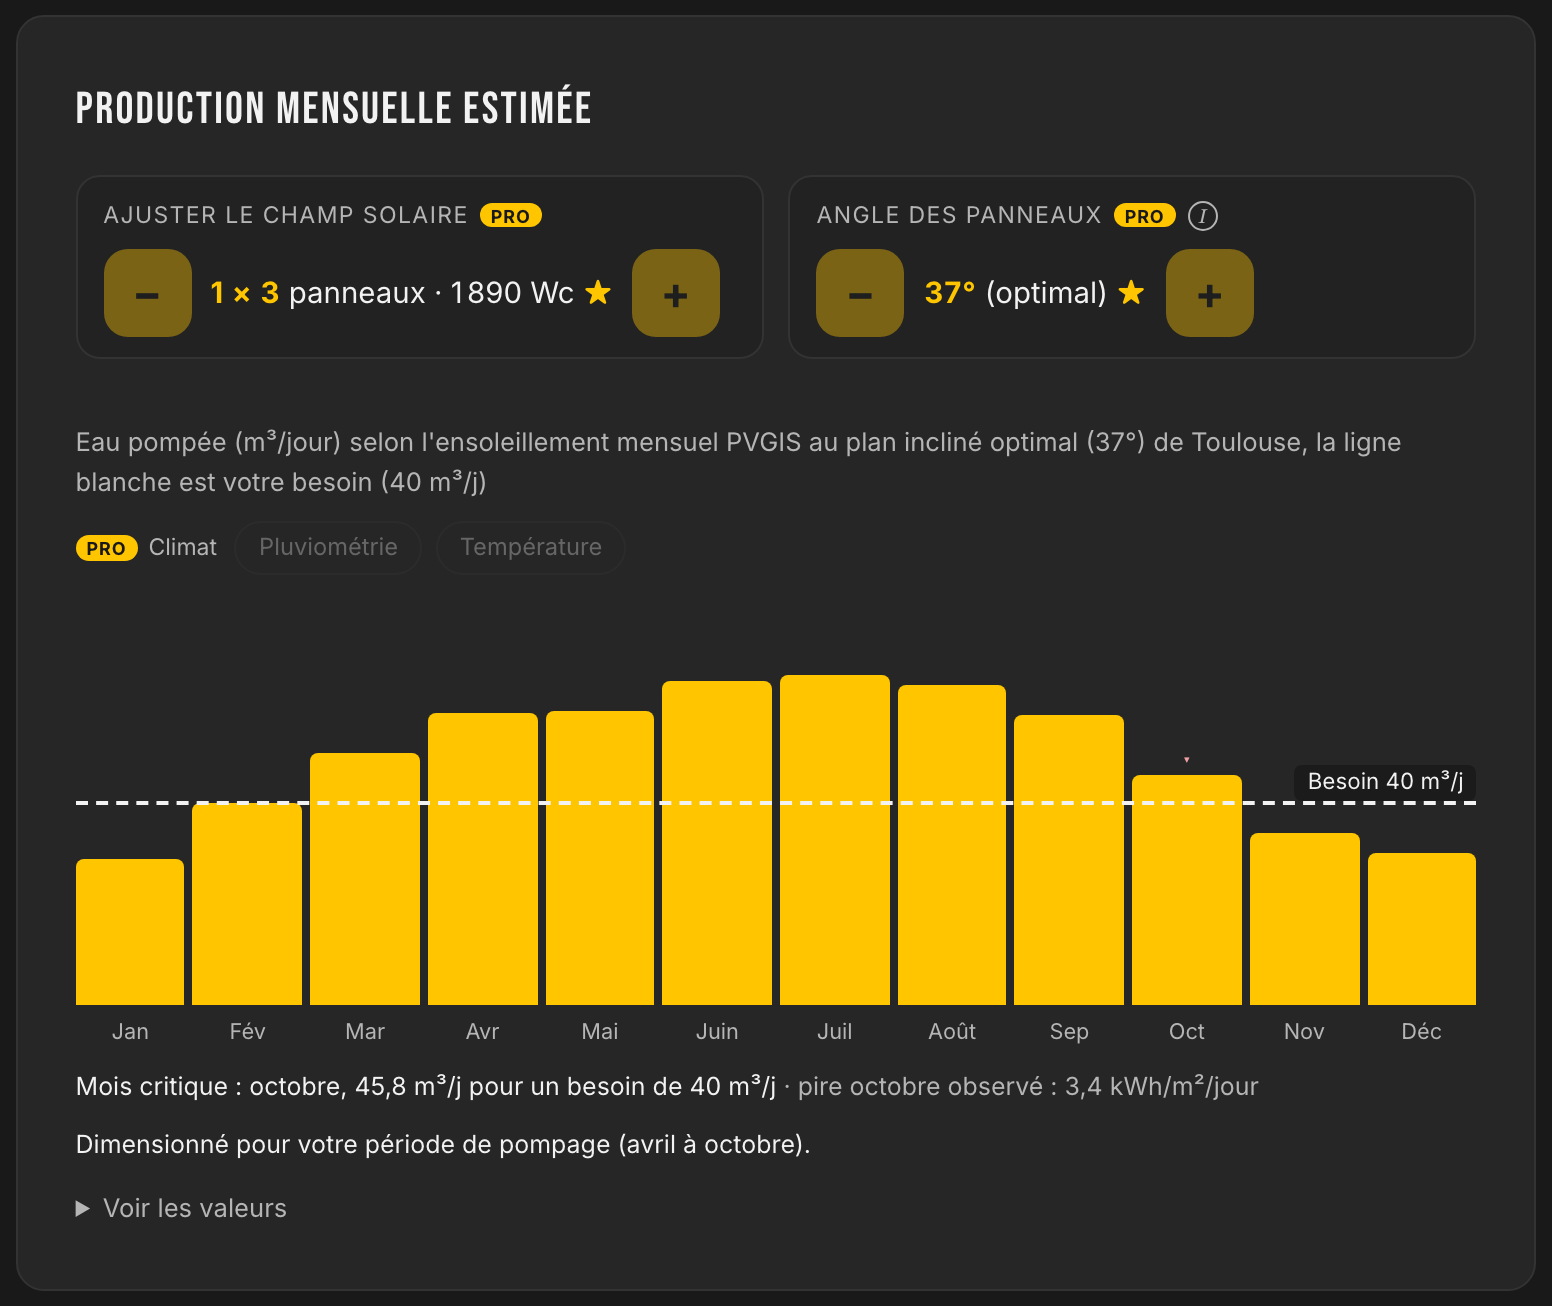
The estimated monthly production, against the line of the need. The critical month of the period is stated under the chart.
The typical day in July shows the flow starting around 07:00, a maximum of 7.4 m³/h around solar noon and an estimated daily volume of 63.0 m³. The gap of 58% against the need indicates additional average capacity for this typical day; it does not on its own define a free watering window nor the coverage of every day of the month.
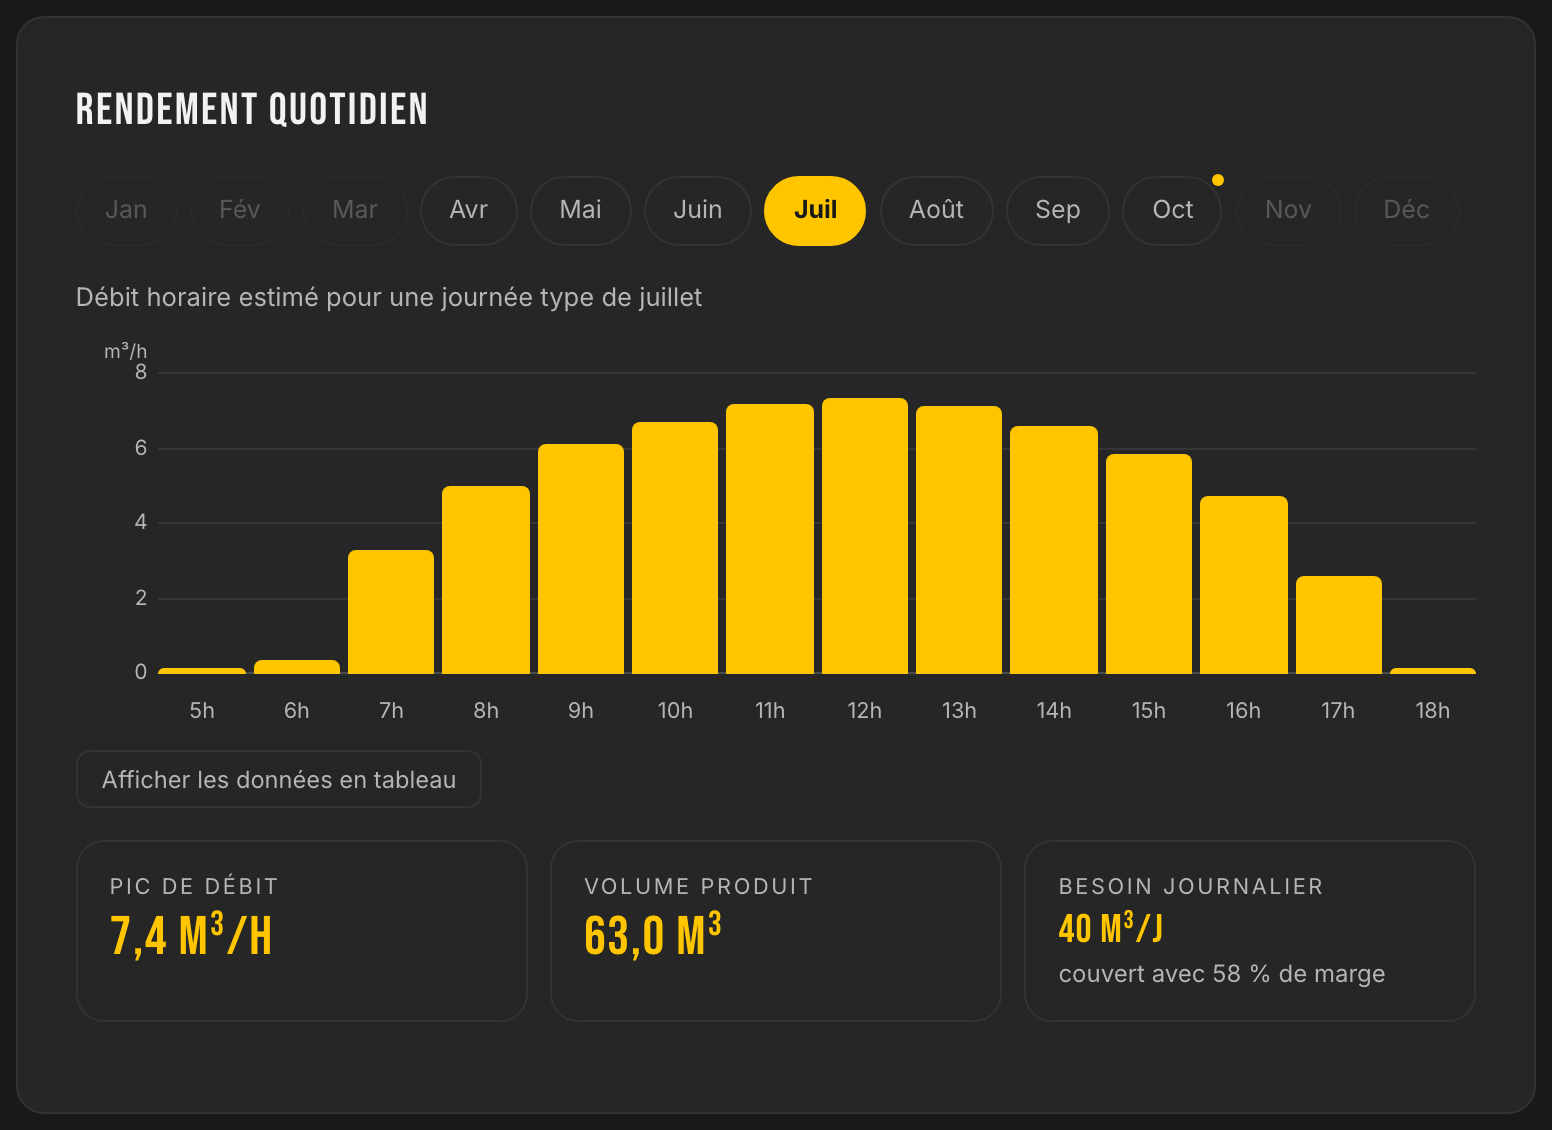
The typical day of the month chosen, hour by hour, with the peak flow and the volume produced.
Conditions for a water intake in a river
The diagram of the study shows the array, the cabinet, the submersible pump at 3 m, the 120 m of pipe and the delivery point. In surface water, the pump can be installed in a sump fed by the river or in a suitable strainer housing, subject to complying with the manufacturer's requirements. A submerged installation stays flooded and does not require daily hydraulic repriming; its starting then depends on the automatic controls, the water level and the power available.
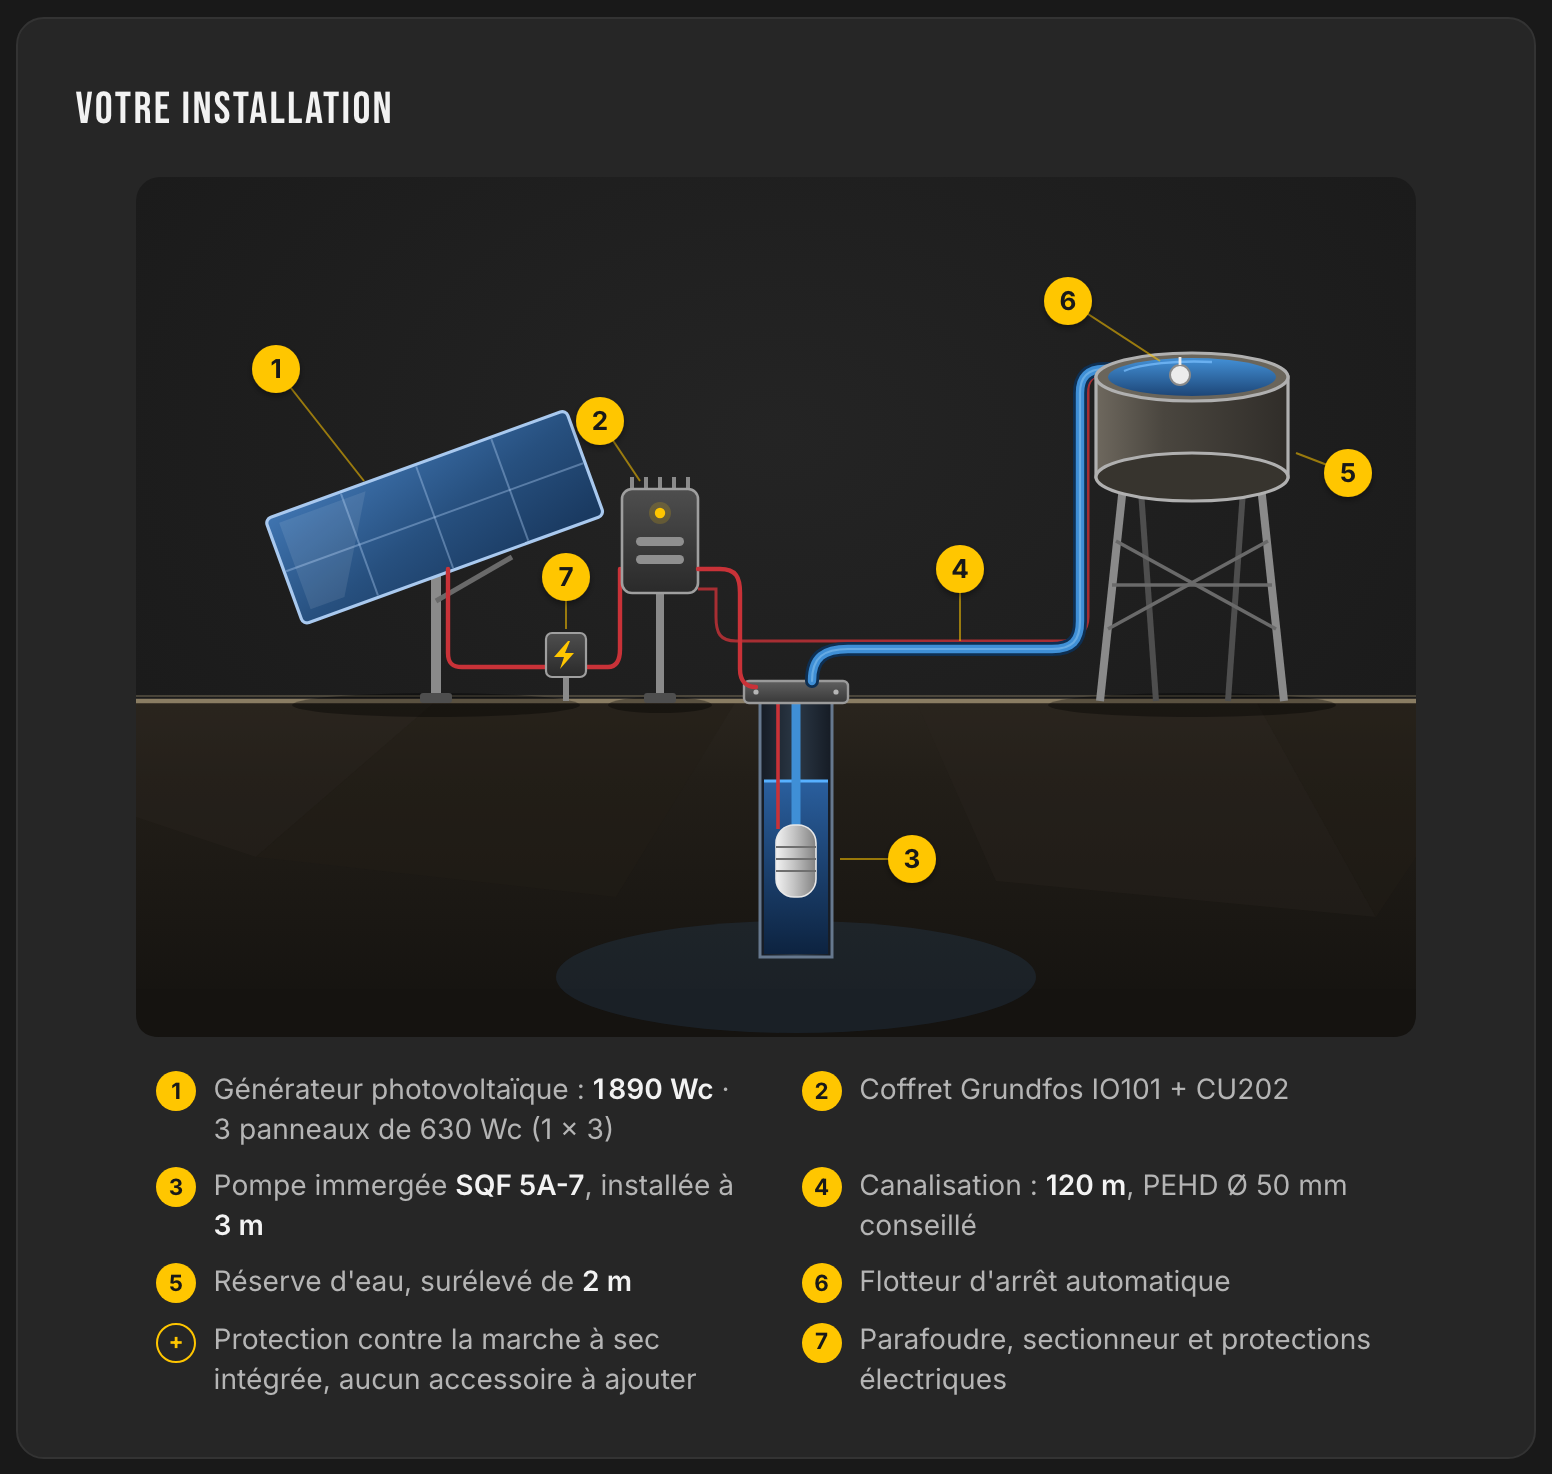
The installation diagram of the study. The arrival point is drawn as a raised reserve: here, it is the head of the micro-irrigation network, 2 m above the pump.
The existing filtration cannot be kept without checking. Its acceptable flow, its fineness, its condition and its head losses must remain compatible with the new pump and with the emitters. The pressure actually required at the filter inlet and at the head of the drip sectors must also be confirmed: the bar reserved at the delivery point is a study assumption, not a measured setpoint. Protection of the suction against coarse debris completes this filtration. The project must also check the low-water level, the variations of the river, protection against floods and the rules applicable to water abstraction.
Frost-protection sprinkling stays with the existing system
Frost-protection sprinkling is triggered mainly at night and at dawn, outside the period of photovoltaic production. It also requires a flow available without interruption throughout the frost episode. The solar system at the pace of the sun presented here is therefore reserved for daily irrigation; the existing thermal pump keeps the frost-protection function.
Separating the uses avoids assigning to the solar system a function it cannot fulfil on its own. The thermal pump remains available for frost episodes, while the solar pump covers seasonal irrigation under the production conditions described by the study.
From the declared need to the technical solution
The application establishes the daily need from the crop and the area, takes the pumping period into account and calculates the total dynamic head from the hydraulic data entered. It then proposes a compatible pipe, pump and photovoltaic array, and presents the monthly production and a typical day for the site studied.
Study a comparable configuration
The application makes it possible to run this path again with the data of another project: crop, area, water resource, pumping period and characteristics of the pipe.