A well, no basin: direct solar
irrigation in Senegal
In Pout, in the Thiès region, a community of growers is preparing a first solar installation on a 5-hectare pilot plot. The project calls for direct pumping from a 30 m well, with no buffer basin, for a demand of 30 m³ per day.
The need, as the client expresses it
The first client of a collective venture: if the pilot plot convinces, the other growers will follow. The brief fits in three lines: pump from the 30 m well, water directly without going through a basin, and target 30 m³ per day. No backup, no storage: the field drinks at the pace of the sun.
The figure to face head-on: 30 m³ per day will not irrigate 5 hectares of market gardening in the dry season. It will irrigate a fraction of it, and that is precisely the spirit of a pilot plot: prove the principle on the first block, then expand the solar array once the community commits.
The input data in LE LAB
A few minutes of input. The solar reference city is Dakar, around fifty kilometres from Pout. The pump is set at around 25 m in the 30 m well, the delivery head to the irrigation network is low and the field-head pipe is taken at 100 m. The total head is calculated automatically: 38 m. And to the water reserve question, the client's answer is respected: none.
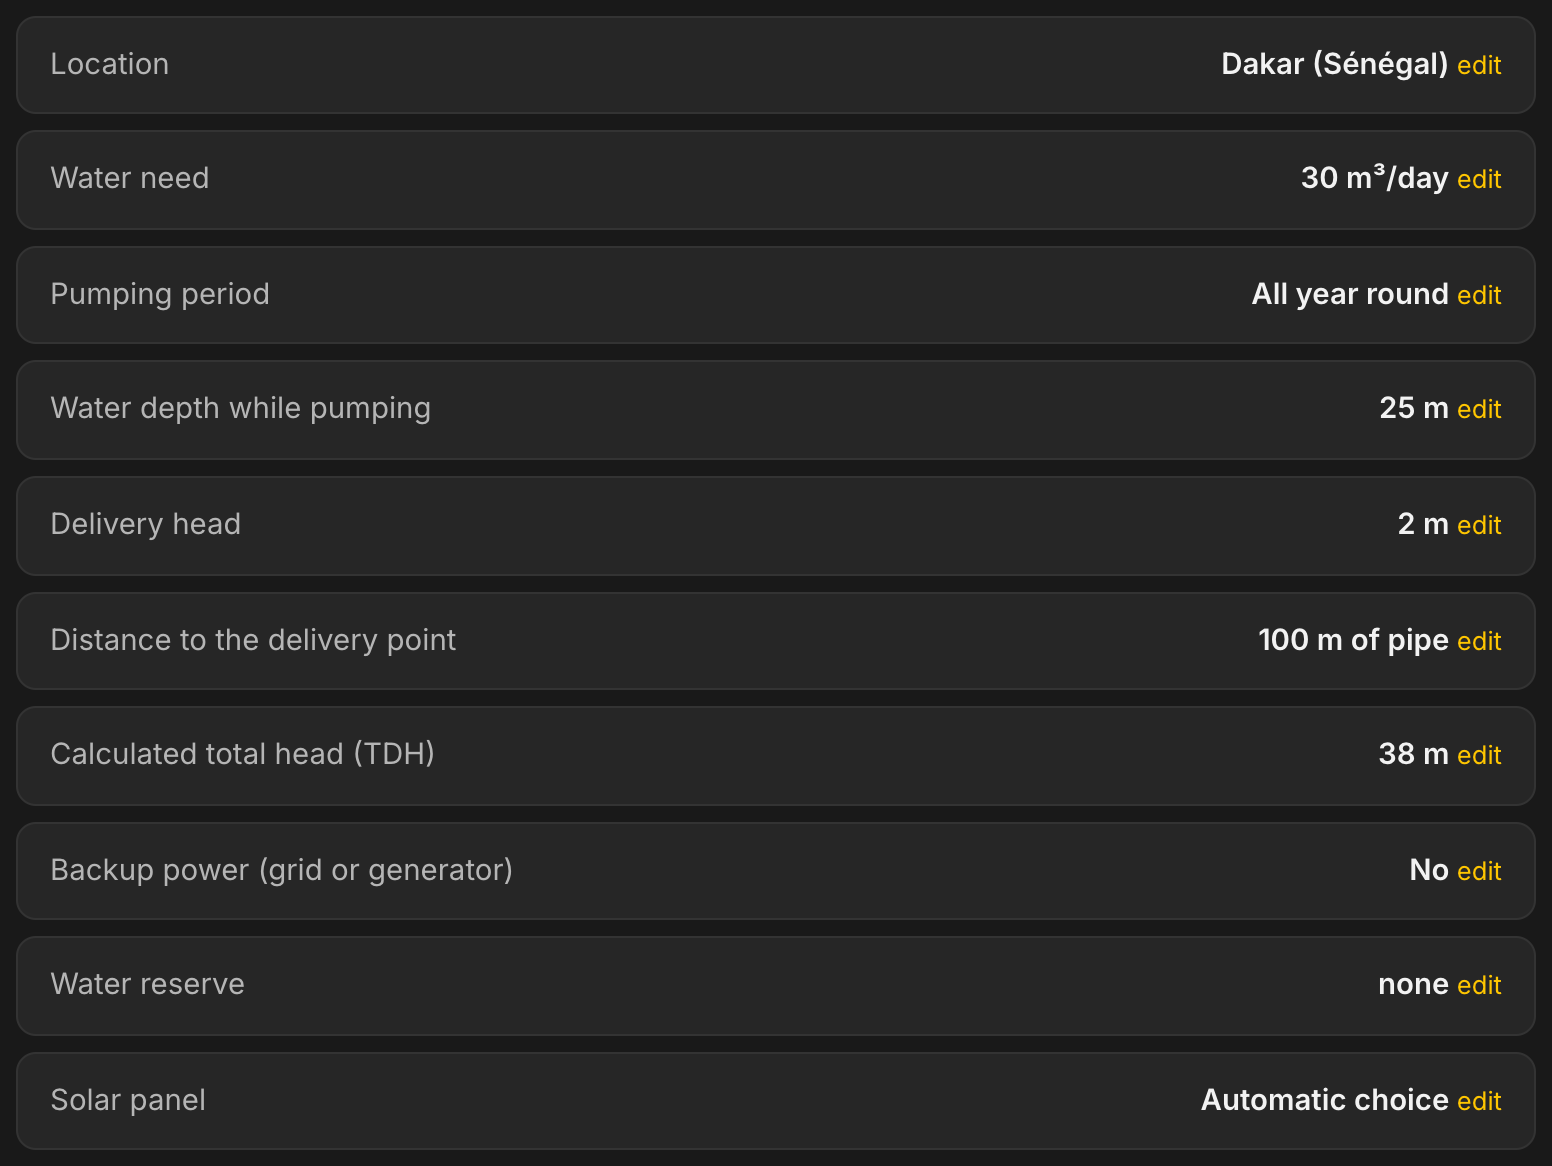
The summary before calculation: nine answers are enough, the total dynamic head is calculated for you.
What LE LAB proposes
A LORENTZ PS2-1800 with the HRE-32 end, a helical rotor, powered by 3 panels of 450 Wp, for 1,350 Wp in a single string. Average production: 35.4 m³ per day, from 29.8 in August to 41.1 at the height of the dry season. LE LAB is multi-brand: the study scans the catalogue and selects the pump whose curves fit the project's operating point, here a LORENTZ; the alternative offered just behind it is a GRUNDFOS SQF 5A-7, which calls for 1,545 Wp of solar array for 33.7 m³ per day.
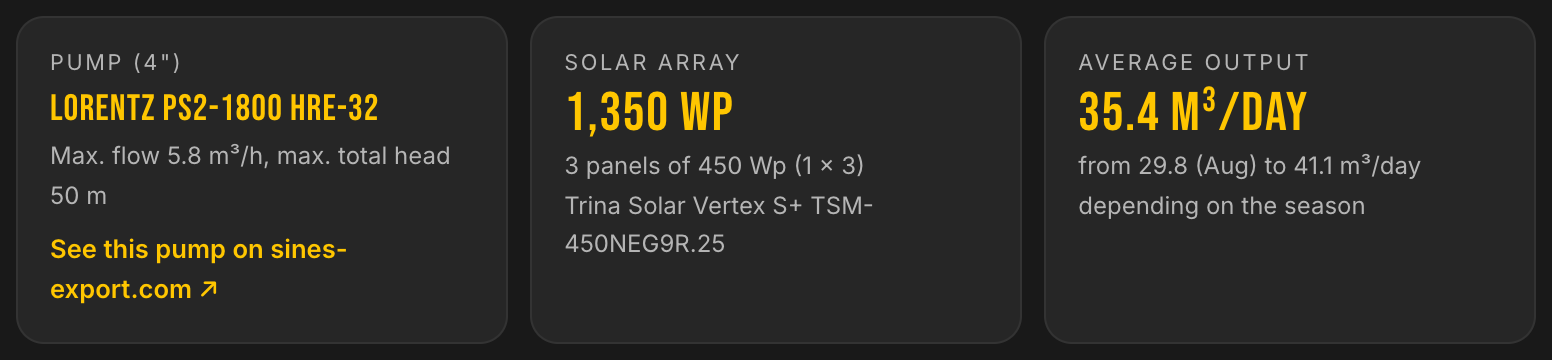
The solution at a glance: pump, solar array and average production.
Production, month by month: a red bar that falls in a good spot
Monthly production is read against the need, over sixteen years of the region's PVGIS solar history. Eleven months stay above the 30 m³ line. The only one that misses the target is August: 29.8 m³ per day, within 1%. The rainfall curve puts this dip in context: August is the heart of the rainy season, 191 mm of rain, the moment when the irrigation need is at its lowest. Effective rainfall and the plot's actual need remain to be assessed on site. Market gardening in Pout, meanwhile, peaks in the dry season, when production runs between 34 and 41 m³.
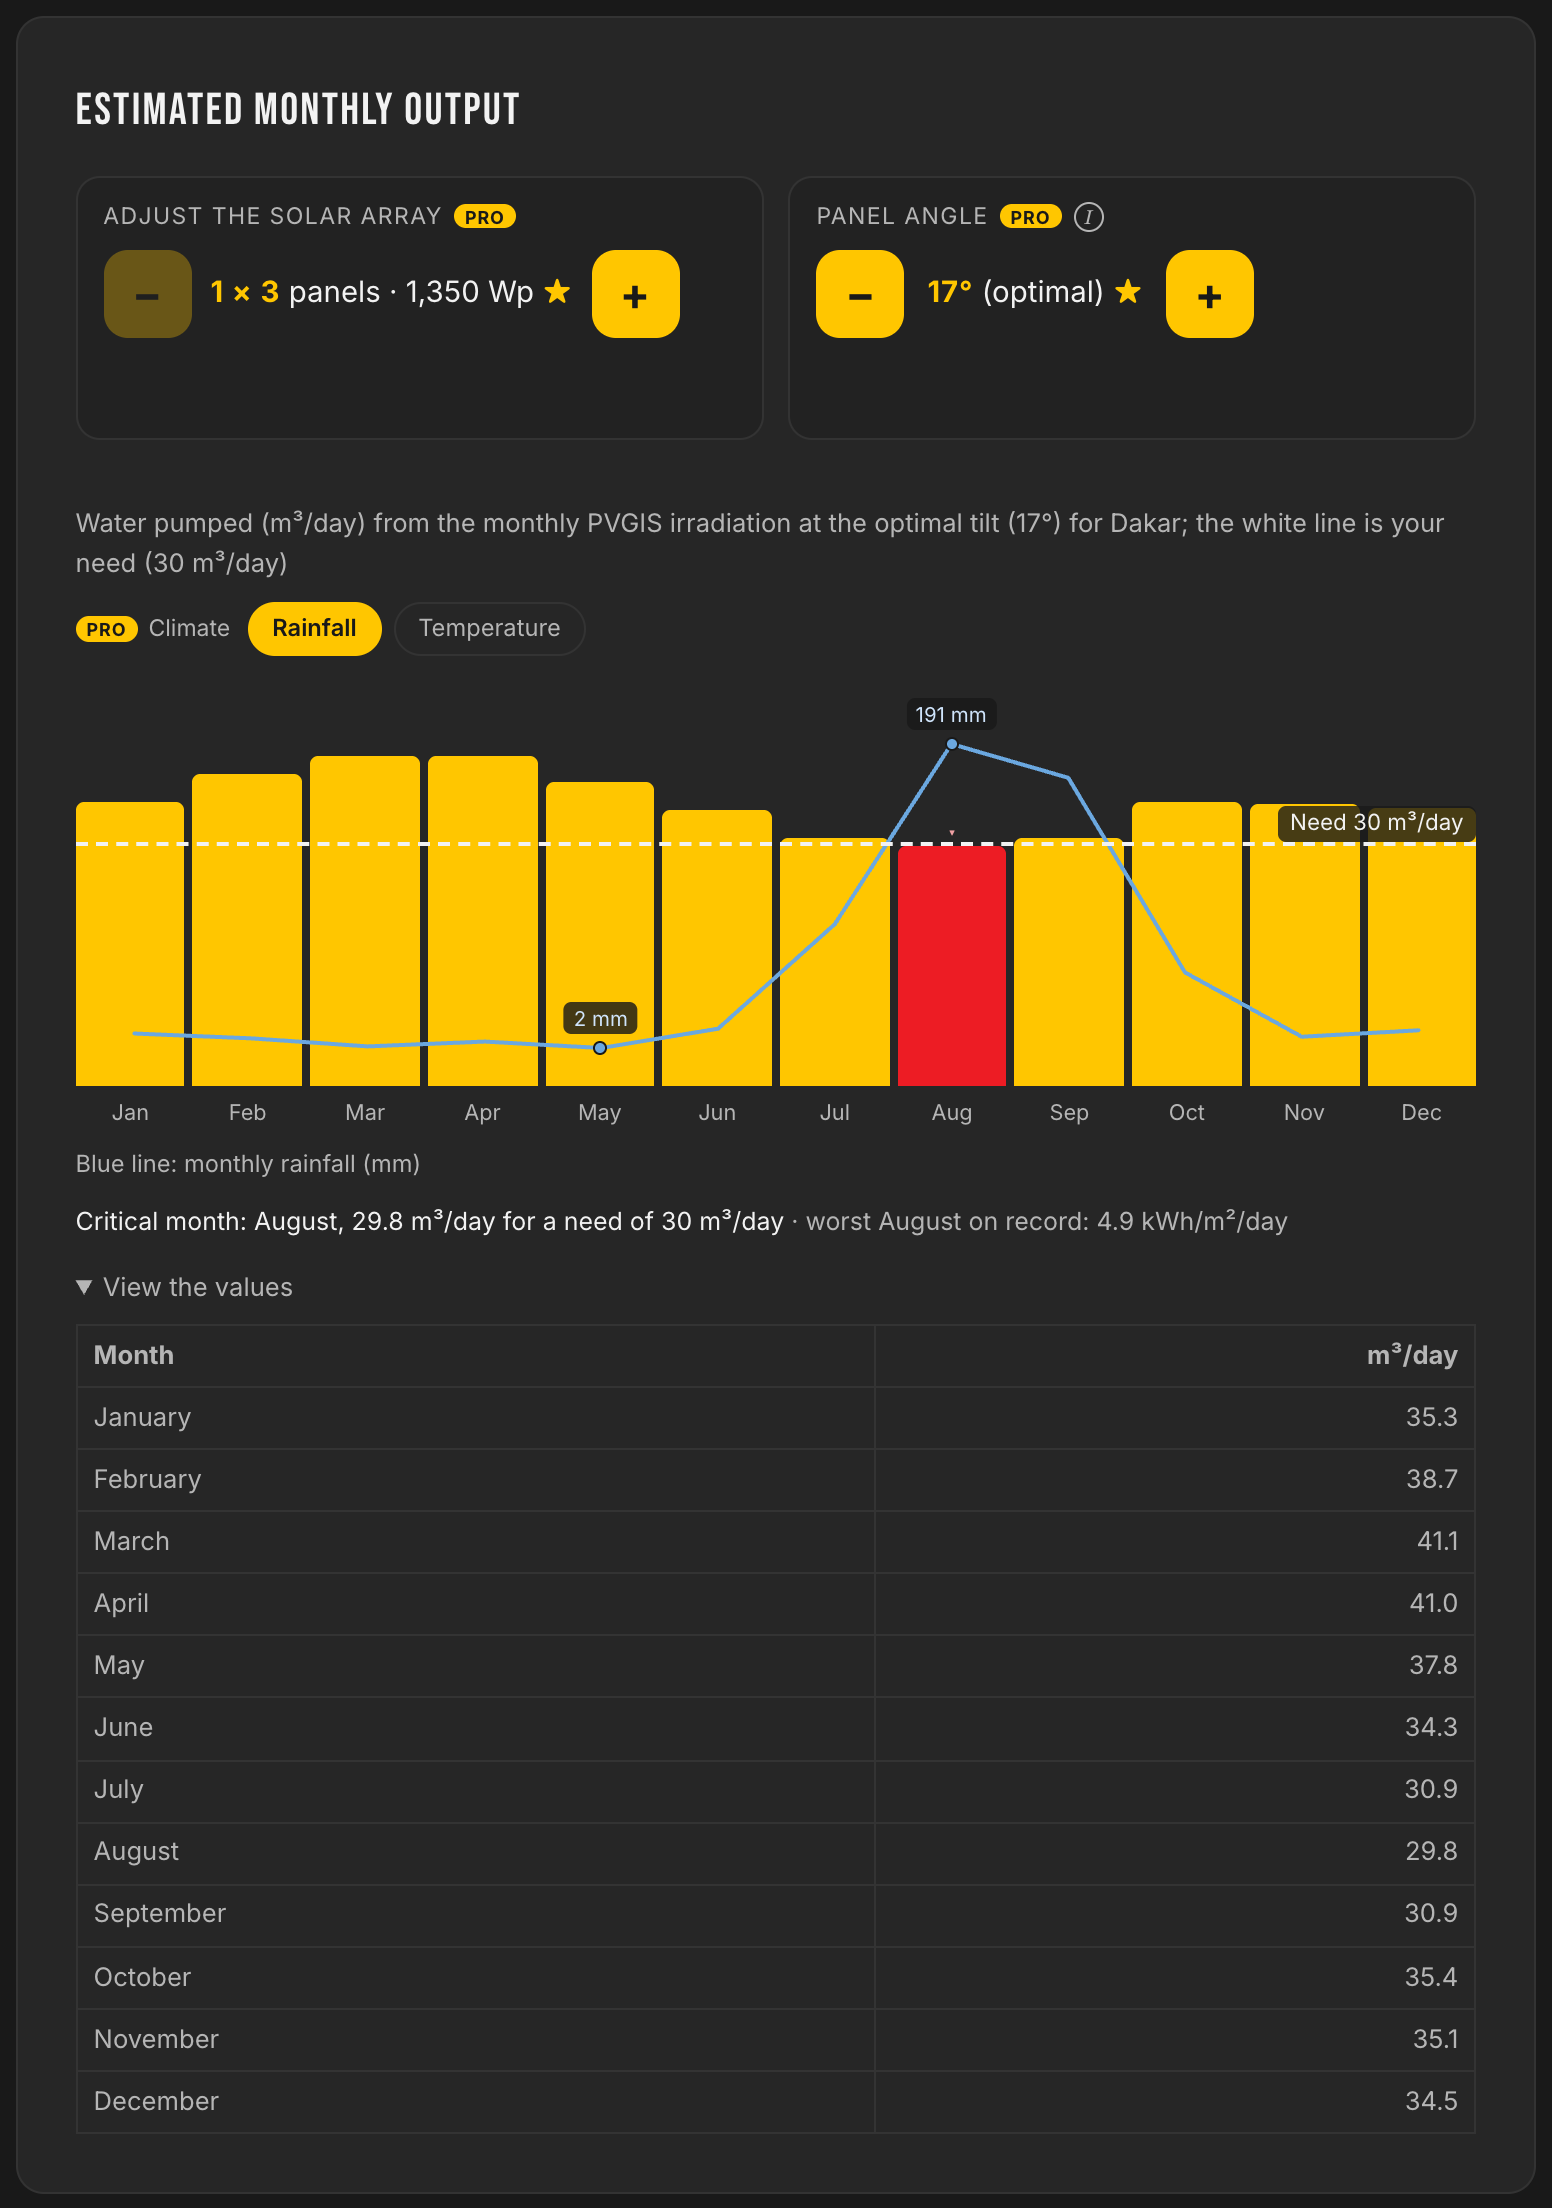
The critical month is shown in red, not hidden: August, 29.8 m³/day for 30 required, under 191 mm of rain. The blue line is monthly rainfall.
The typical day: watering at the rhythm of the sun
With no basin, daily output becomes the grower's working tool: it dictates when the water flows. The typical August day shows a plateau from 11 am to 2 pm around 4.5 m³/h, with a peak at 4.6 m³/h: watering rotations are scheduled around this window, and drip irrigation does the rest. In August, the tightest month, the day produces 30.3 m³: the need is covered with a 1% margin, right at the edge.
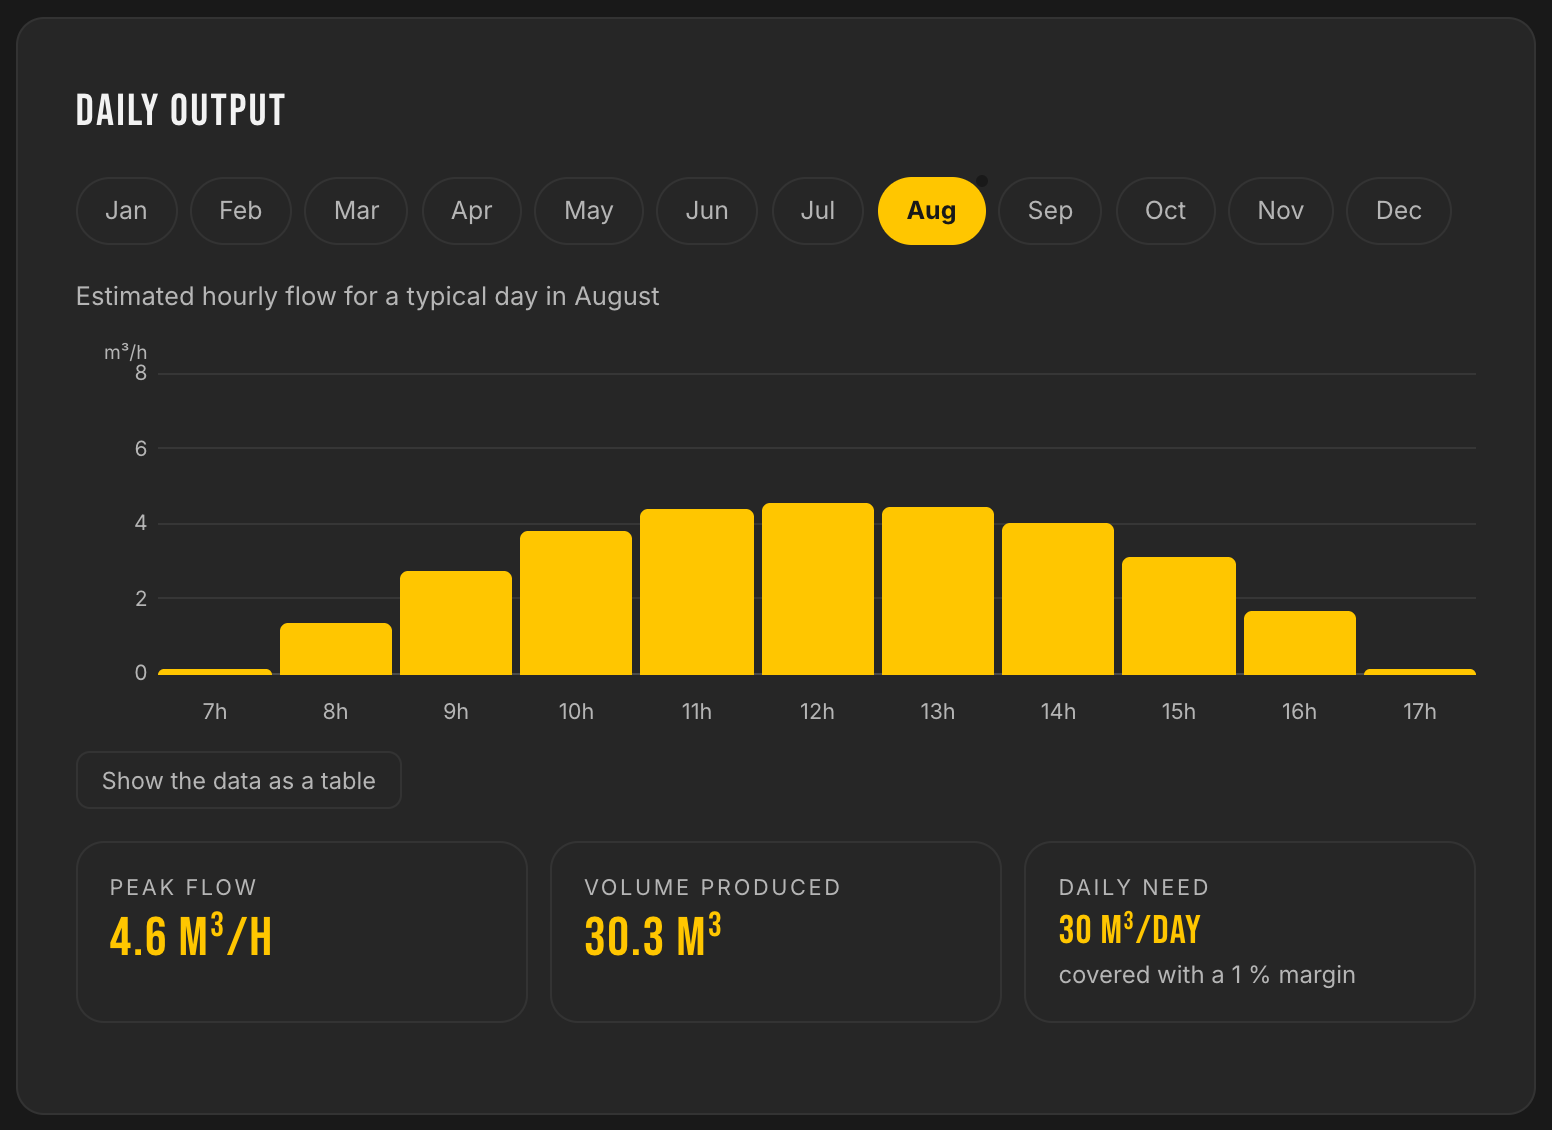
The typical August day, hour by hour: the midday plateau is the irrigation window.
No reservoir: coverage, quantified
The choice of direct supply is respected, and its price is shown. Without a water reserve, the installation covers the need in full 309 days out of 365. On the other 56 days, the pump still delivers 71% of the need on average, and four days a year fall below 20%. The chart shows where these days concentrate: July, August, September, the rainy season, precisely when the irrigation need drops.
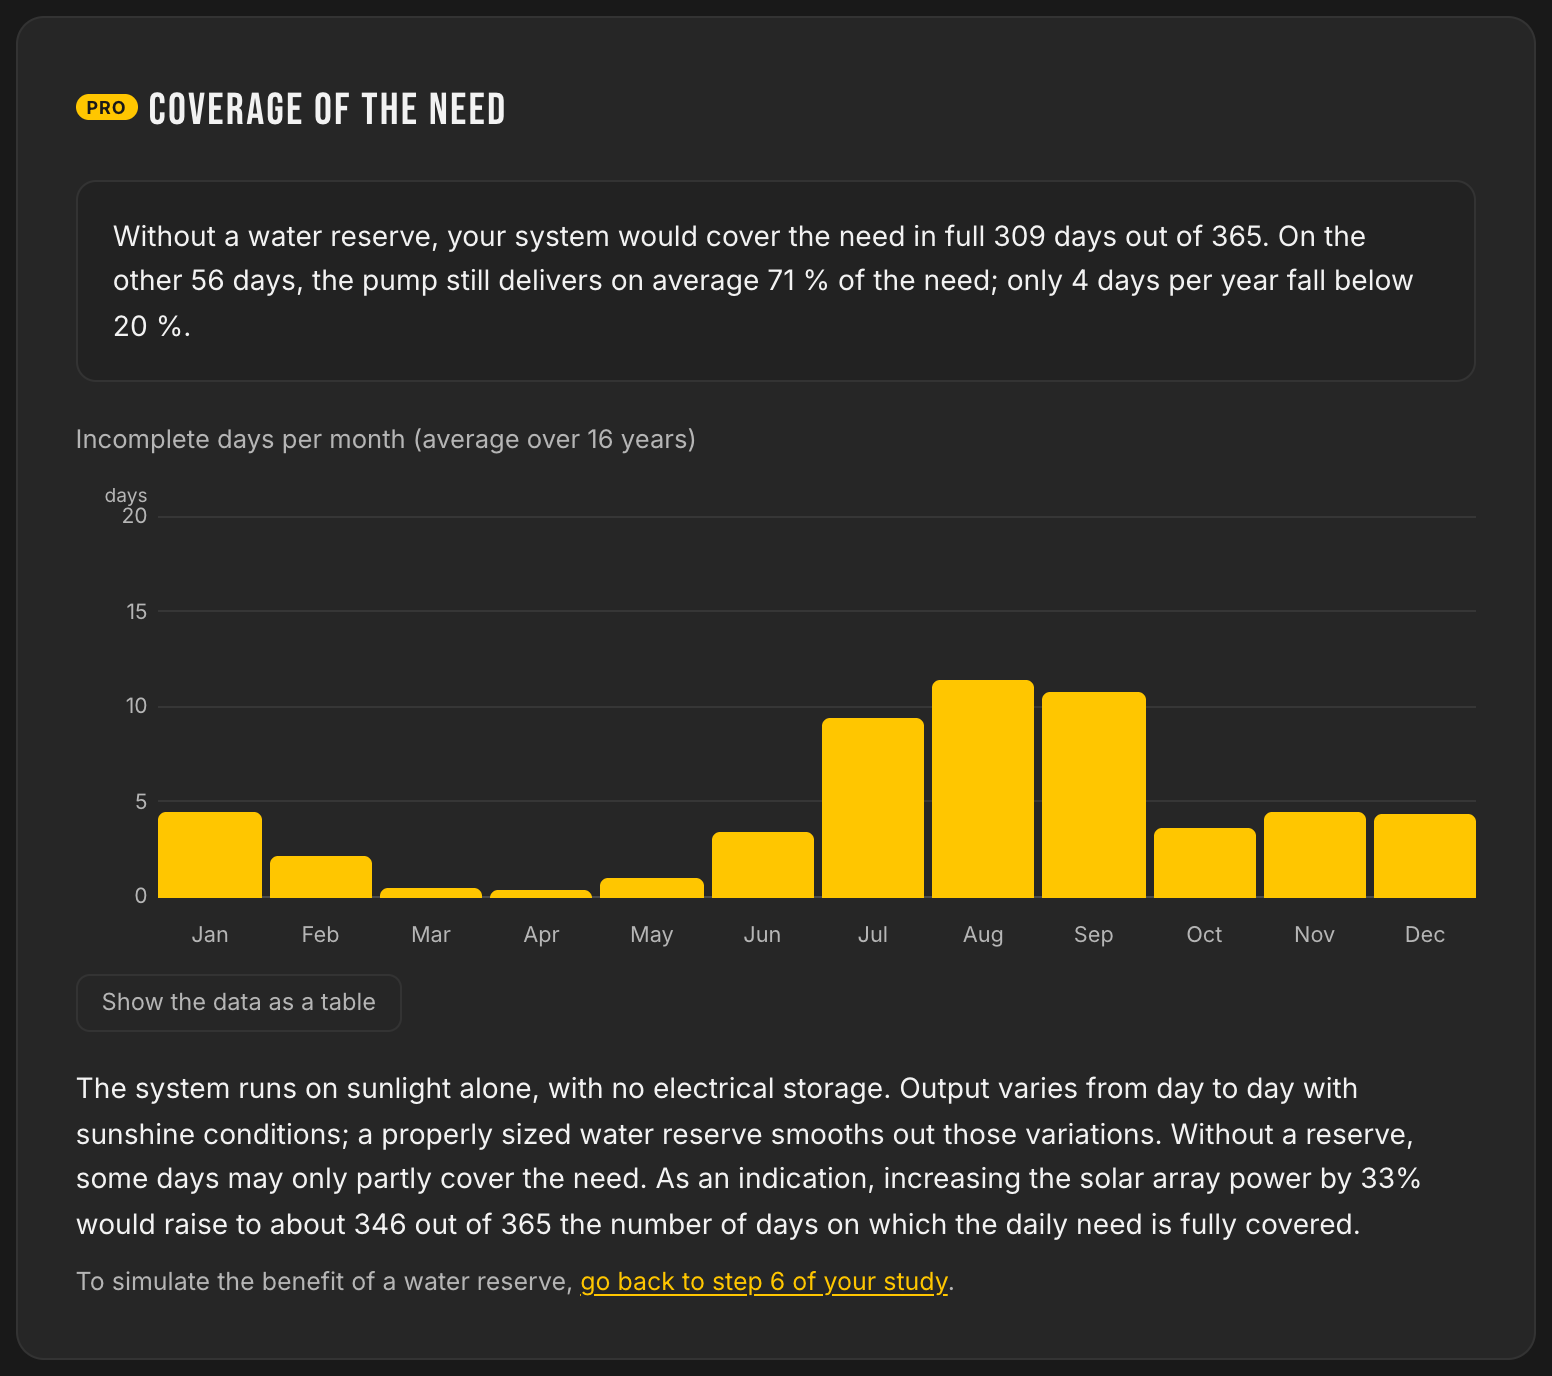
A benchmark is given too: 33% more panels would raise coverage to around 346 days out of 365. And if a basin enters the project one day, LE LAB simulates it on demand.
Manufacturer curves, at the real operating point
The pump's Q/H curves, plotted from official LORENTZ data, with the project's head highlighted: 5.5 m³/h at full power on the 38 m curve. The pump accepts up to 5.8 m³/h and 50 m of head: at 38 m the project sits at the pump's maximum, and the application says so in plain words.
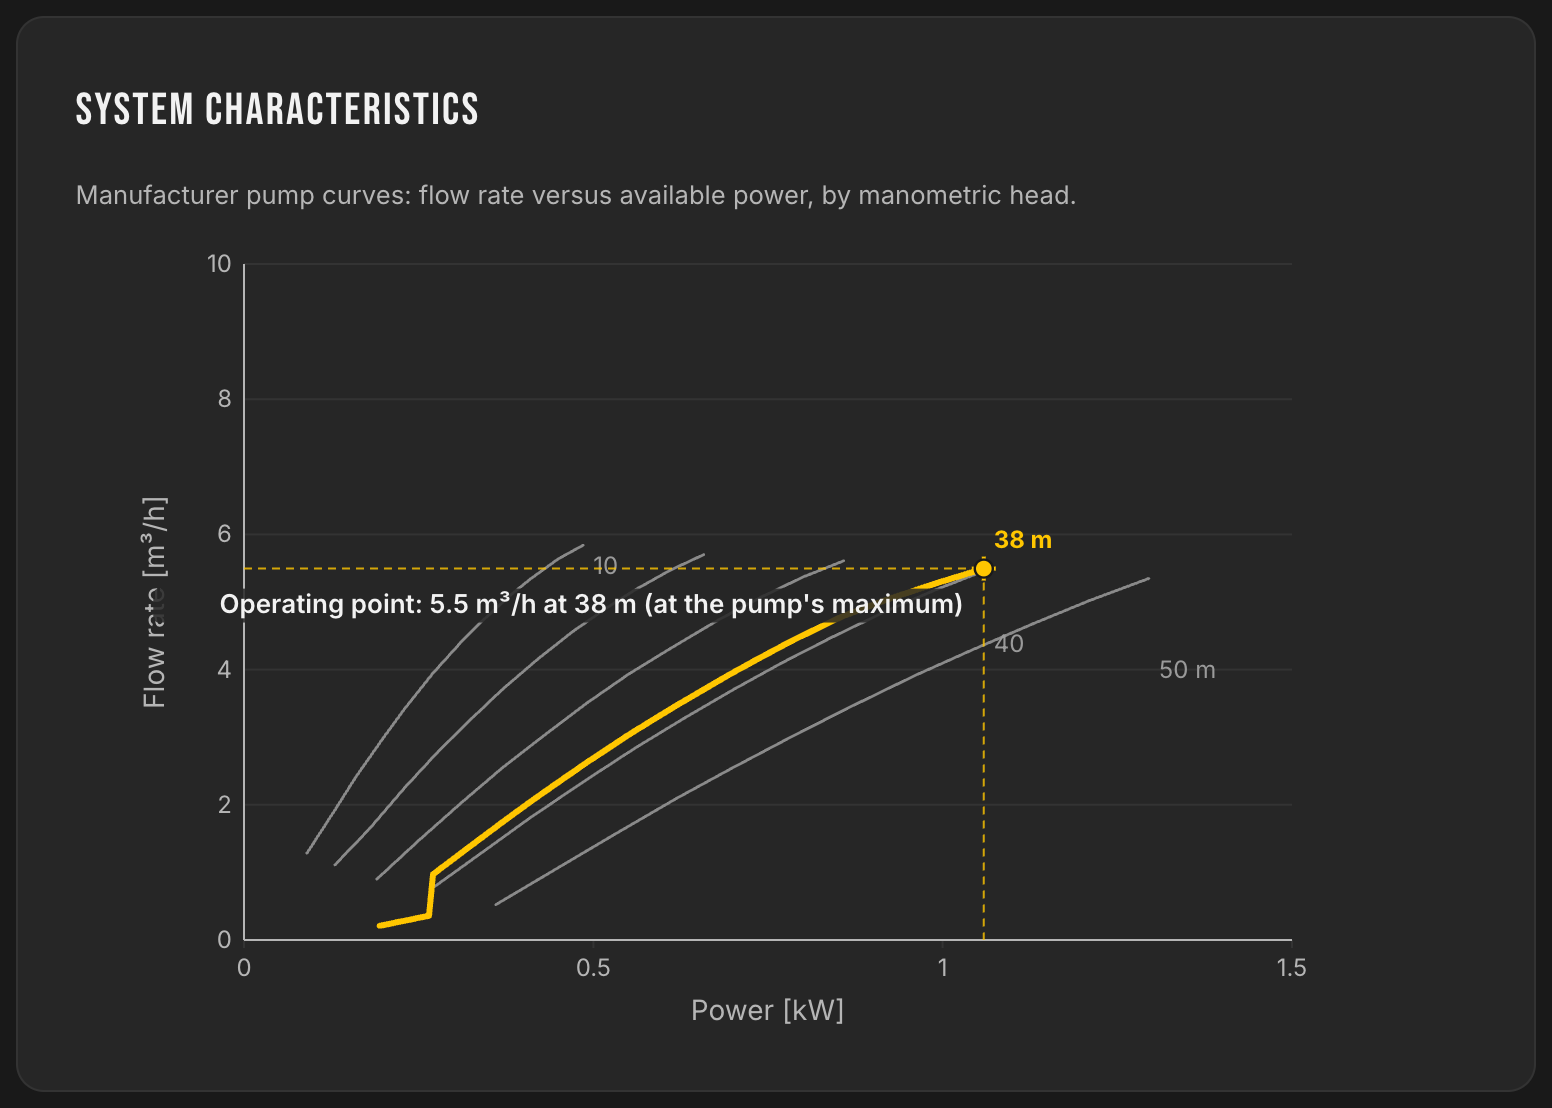
Flow according to available power, by head. The yellow curve is the project's, at 38 m.
The tool frames, the trade decides
Your project deserves the same study
Replay this study with your own figures: location, need, well or borehole. Free, no registration, results in a few minutes.